Mosaic analysis during slew#
Edit here only trigid, trigger_time and your user_name
trigid = '647252296_c0'
triggertime = '2021-07-06T08:17:49.000'
user_name = 'samueleronchini'
root = f'/home/idies/workspace/Storage/{user_name}/persistent'

# create data directory and work dir if it does not exist
import os
data_dir = f'{root}/{trigid}/data'
if not os.path.exists(data_dir):
    os.makedirs(data_dir)

workdir = f'{root}/{trigid}'
if not os.path.exists(workdir):
    os.makedirs(workdir)

def filter_data(obsid):
    command = f'python -m nitrates.data_prep.mkdb --work_dir {root}/{trigid} '
    ! echo {command}
    ! {command}

    command = '' \
    '' \
    'python -m nitrates.data_prep.do_data_setup ' \
    f'--work_dir {root}/{trigid}' \
    f' --trig_time {triggertime}' \
    f' --evfname {root}/data/{obsid}/bat/event/sw{obsid}bevshsl_uf.evt.gz' \
    f' {root}/data/{obsid}/bat/event/sw{obsid}bevshpo_uf.evt.gz' \
    f' --dmask {root}/data/{obsid}/bat/hk/sw{obsid}bdecb.hk.gz' \
    f' --att_fname {root}/data/{obsid}/auxil/sw{obsid}pat.fits.gz' \
    f' --acs_fname {root}/data/{obsid}/auxil/sw{obsid}pat.fits.gz' \
    f' --data_dbfname {root}/{trigid}/results.db'

    ! echo {command}
    ! {command}
We first get data from GUANO, using swifttools. For a completed guide to use GUANO API, see https://www.swift.psu.edu/too_api/index.php?md=Swift GUANO Example Notebook.ipynb
import matplotlib.pyplot as plt
import numpy as np
import astropy.units as u
import os
import batanalysis as ba

import logging
import time
from pathlib import Path
import traceback
from swifttools.swift_too import GUANO, Clock, Data

logging.basicConfig(level=logging.INFO, format='%(asctime)s - %(levelname)s - %(message)s')

import warnings
warnings.filterwarnings("ignore")


def guano_query(triggertime, ext_obsid, workdir, datadir):

    if '.' not in triggertime.split('T')[1]:
        triggertime = triggertime + '.000Z'
    else:
        triggertime = triggertime + 'Z'

    logging.info(f'Using triggertime: {triggertime}')

    guano = GUANO(triggertime=triggertime, successful = False)

    logging.info(guano)

    for item in guano: # this loop is required if multiple triggers are associated with the same obsid
        logging.info(f'running {item}')

        if item.data.exposure is None:
            logging.error(f'No exposure time found for obsid {item.obsid}. Skipping this obsid.')
            exit()

        if ext_obsid is not None:
            obsid = ext_obsid
        else:
            obsid = item.obsid

        start_time_try = time.time()
        event = None
        while time.time() - start_time_try < 1800 and event is None:
            try:
                '''
                We need to remove any data or results already existing, since BatAnalysis can have problems
                '''
                # Remove directories if they exist
                obsid_dir = f"{datadir}/{obsid}"
                obsid_eventresult_dir = f"{datadir}/{obsid}_eventresult"
                if os.path.exists(obsid_dir):
                    os.system(f"rm -rf {obsid_dir}")
                if os.path.exists(obsid_eventresult_dir):
                    os.system(f"rm -rf {obsid_eventresult_dir}")


                data = Data(obsid=obsid, bat=True, outdir=datadir, clobber=True, uksdc=True)
                logging.info(data)
                ba.datadir(datadir)
                event = ba.BatEvent(obsid, is_guano=True)

                # filter data using nitrates
                filter_data(obsid)

                # We use here the filtered files produced by NITRATES
                event.detector_quality_file = Path(f'{workdir}/detmask.fits')
                event.event_files = Path(f'{workdir}/filter_evdata.fits')
                event.attitude_file = Path(f'{workdir}/attitude.fits')

                event._parse_event_file()

                ba.mosaic._pcodethresh = 0.01

            except Exception:
                logging.error(f"Failed to create Data and BatEvent for obsid {obsid}: {traceback.format_exc()}")

    return event
event = guano_query(triggertime, None, workdir, f'{root}/data')
Convert the t0 from UTC to MET
t0 = Clock(utctime=triggertime+'Z').met
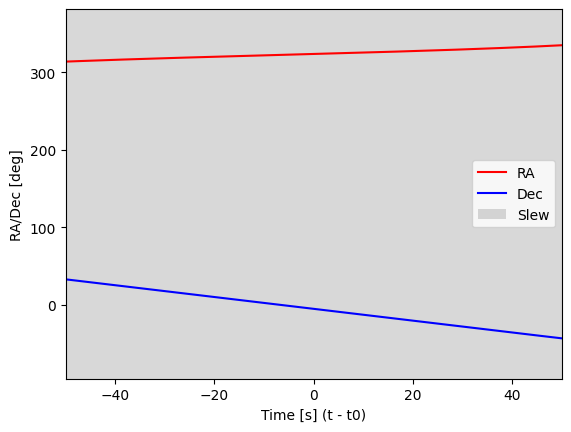
Visualising the attitude info#
plt.plot(event.attitude.time.value-t0, event.attitude.ra, label='RA', color='red')
plt.plot(event.attitude.time.value-t0, event.attitude.dec, label='Dec', color='blue')

# Identify intervals where RA and Dec change
ra_diff = np.diff(event.attitude.ra.value)
dec_diff = np.diff(event.attitude.dec.value)
margin = 1 / 60  # Margin of 1/60 degree, i.e., 1 arcmin
change_indices = np.where((np.abs(ra_diff) > margin) | (np.abs(dec_diff) > margin))[0]

for idx in change_indices:
    plt.axvspan(event.attitude.time[idx].value - t0, event.attitude.time[idx + 1].value - t0, color='gray', alpha=0.3, linewidth=0, label='Slew' if idx == change_indices[0] else None)

plt.xlim(-50, 50)
plt.xlabel("Time [s] (t - t0)")
plt.ylabel("RA/Dec [deg]")
plt.legend()
plt.show()
plt.savefig(f'{workdir}/attitude.png', dpi=500)
plt.close()
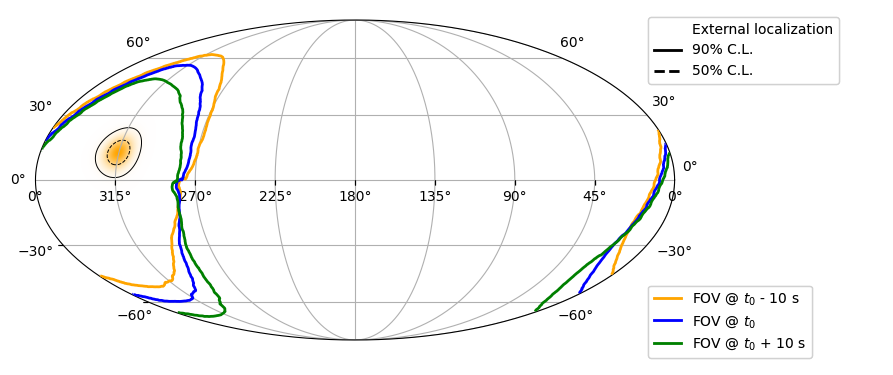
Check the external position with respect to BAT FOV#
output_file = os.path.join(workdir, 'ext_loc_fermi.fit')
! curl -o {output_file} https://heasarc.gsfc.nasa.gov/FTP/fermi/data/gbm/triggers/2021/bn210706346/quicklook/glg_healpix_all_bn210706346.fit
  % Total    % Received % Xferd  Average Speed   Time    Time     Time  Current
                                 Dload  Upload   Total   Spent    Left  Speed
100 1549k  100 1549k    0     0   435k      0  0:00:03  0:00:03 --:--:--  435k
from matplotlib.lines import Line2D
import ligo.skymap.io
import ligo.skymap.plot
import ligo.skymap.postprocess

from matplotlib.colors import LinearSegmentedColormap

def map_ext(fit_file, workdir, ax_globe):

    skymap, _ = ligo.skymap.io.fits.read_sky_map(os.path.join(workdir, fit_file), nest=True, distances=False)
    skymap_prob = skymap.copy()

    white_to_blue = LinearSegmentedColormap.from_list("whiteblue", ["white", "orange"])

    ax_globe.imshow_hpx((skymap_prob, 'ICRS'), cmap=white_to_blue, alpha=1.0, nested=True, zorder=0)

    cls = 100 * ligo.skymap.postprocess.util.find_greedy_credible_levels(skymap)

    ax_globe.contour_hpx((cls, 'ICRS'), nested=True, colors='black',
                        levels=(50, 90), zorder=0,
                        linestyles=['dashed', 'solid'],
                        linewidths=0.7)

    loc_line = [
        Line2D([0], [0], color='red', linestyle='dotted', linewidth=2, label='External localization', alpha=.0),
        Line2D([0], [0], color='black', linestyle='solid', linewidth=2, label='90% C.L.'),
        Line2D([0], [0], color='black', linestyle='dashed', linewidth=2, label='50% C.L.')
    ]

    return loc_line


def map_mosaic(event, t0, workdir):

    fig = plt.figure(figsize=(11, 5))

    ax_globe = fig.add_axes([
        0.05,  # left
        0.10,  # bottom
        0.68,  # width
        0.80   # height
    ],projection='astro degrees mollweide',
        )
    ax_globe.grid()

    ax_globe.set_position([0.08, 0.12, 0.84, 0.64])

    pcc_mapp_arr = []

    time_bins=[[-10,-9],[-1,+1],[10,11]]*u.s
    for n in range(0,3):
        settled_skyview = event.create_skyview(timebins=time_bins[n], energybins= [15, 350]*u.keV, is_relative=True, T0=t0)
        pcc_mapp_arr.append(settled_skyview.pcode_img.healpix_projection(coordsys="icrs", nside=256).contents[0,:,0])
    pcc_mapp_arr = np.array(pcc_mapp_arr)

    col = ['orange', 'blue', 'green']
    ls = [ 'solid', 'solid', 'solid']
    for n in range(0,3):
        ax_globe.contour_hpx((pcc_mapp_arr[n], 'ICRS'), nested=False, colors=col[n], levels=[0.01], linewidths=2, linestyles=ls[n])

    fov_line = [Line2D([0], [0], color='orange', linestyle='solid', linewidth=2, label='FOV @ $t_0$ - 10 s' ),
    Line2D([0], [0], color='blue', linestyle='solid', linewidth=2, label='FOV @ $t_0$'),
    Line2D([0], [0], color='green', linestyle='solid', linewidth=2, label='FOV @ $t_0$ + 10 s')]


    fit_file = next((fname for fname in os.listdir(workdir) if 'ext_loc' in fname), None)
    loc_handles = None
    if fit_file:
        loc_handles = map_ext(fit_file, workdir, ax_globe)

    ax_leg_top = fig.add_axes([0.76, 0.5, 0.22, 0.28])
    ax_leg_top.axis('off')
    if loc_handles is not None:
        leg_ext = ax_leg_top.legend(handles=loc_handles, loc='upper left', frameon=True, borderaxespad=0.5)
        ax_leg_top.add_artist(leg_ext)

    # Asse inferiore: legenda partial coding
    ax_leg_bot = fig.add_axes([0.76, 0.07, 0.22, 0.28])
    ax_leg_bot.axis('off')

    fov_legend = ax_leg_bot.legend(handles=fov_line, loc='lower left', frameon=True, borderaxespad=0.5)
    ax_leg_bot.add_artist(fov_legend)

    plt.savefig(os.path.join(workdir,'map_mosaic.png'), bbox_inches='tight', dpi=300)
    plt.show()
    plt.close()

map_mosaic(event, t0, workdir)
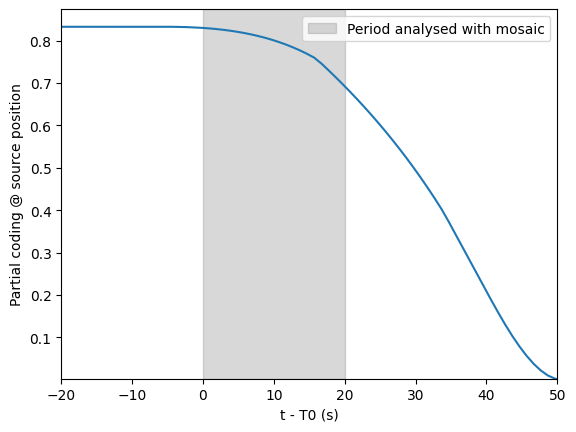
Partial coding at the max of the external localization#
We first derive most probable position of external localization
from astropy.coordinates import SkyCoord
import astropy.units as u
import healpy as hp


def derive_most_probable_position(fit_file, workdir):
    skymap, _ = ligo.skymap.io.fits.read_sky_map(os.path.join(workdir, fit_file), distances=False) # remove nest=True to have the correct coordinates
    max_idx = np.argmax(skymap)
    theta, phi = hp.pix2ang(hp.get_nside(skymap), max_idx)
    ra_deg = np.degrees(phi)
    dec_deg = 90 - np.degrees(theta)
    return ra_deg, dec_deg
Here instead of using partial coding maps for many time bins (computationally expensive). We can derive the exposure at a given sky position as a function of time. Exposure here is meant as the fraction of active detectors that are exposed to light coming from a given source
5240 cm^2 is a good estimate of the current detecting area of BAT assuming all the detectors are active.
exp_area = 5240
fit_file = next((fname for fname in os.listdir(workdir) if 'ext_loc' in fname), None)
ra_max, dec_max = derive_most_probable_position(fit_file, workdir)

print(f"Most probable position: RA={ra_max}, Dec={dec_max}")

def pc_time(ra, dec, event, t0, timebins, workdir):

    fig = plt.figure()

    import swiftbat

    object_batsource = swiftbat.source(
        ra=ra, dec=dec, name='pc_time'
    )

    time = event.attitude.time.value - t0*np.ones(len(event.attitude.time))

    exposures = np.array(
        [object_batsource.exposure(ra=ra,
                                dec=dec,
                                roll=roll)[0]
            for ra,dec,roll in zip(event.attitude.ra,event.attitude.dec,event.attitude.roll)
        ])

    plt.plot(time,exposures/exp_area)
    plt.xlim(-20,50)
    time_window_mask = (time >= -20) & (time <= 50)
    plt.ylim(min(exposures[time_window_mask]/exp_area)*0.95,
              max(exposures[time_window_mask]/exp_area)*1.05)
    plt.axvspan(timebins[0].value, timebins[1].value, color='gray', alpha=0.3,
                 label="Period analysed with mosaic")
    plt.legend()
    plt.xlabel('t - T0 (s)')
    plt.ylabel('Partial coding @ source position')
    plt.savefig(os.path.join(workdir, 'pc_time.png'), dpi=300)


pc_time(ra_max, dec_max, event, t0, [0, +20]*u.s, workdir)
Most probable position: RA=315.3515625, Dec=12.635625093021119
Count Rate light curve#
We define here a function to read event data fits file
import astropy.io.fits as fits

def load_event_times(filename):
    with fits.open(filename) as hdul:
        for hdu in hdul:
            if hdu.name == "EVENTS":
                event_times = hdu.data["TIME"]
            if hdu.name == "GTI":
                gti_start = hdu.data["START"]
                gti_stop = hdu.data["STOP"]
    return event_times, gti_start, gti_stop
The filtered event data gives Good Time Intervals, namely intervals where data are reliable. The following function creates a mask to select counts only during GTIs
def bin_light_curve(times, bin_size, gti_start, gti_stop, t0):

    time_min = t0 - 50  # Start time for binning
    time_max = t0 + 150  # End time for binning

    # Create bins from time_min to time_max
    bins = np.arange(time_min, time_max + bin_size, bin_size)
    bin_centers = bins[:-1] + 0.5 * bin_size

    # Find mask for good bins (not intersecting with any bad interval)
    good_mask = np.ones_like(bin_centers, dtype=bool)
    # Vectorized GTI mask: keep bins fully inside any GTI interval
    left_edges = bin_centers - 0.5 * bin_size
    right_edges = bin_centers + 0.5 * bin_size

    # For each bin, check if it is fully inside any GTI interval
    # This creates a (n_bins, n_gti) boolean array
    in_gti = (left_edges[:, None] >= gti_start[None, :]) & (right_edges[:, None] <= gti_stop[None, :])
    good_mask = np.any(in_gti, axis=1)

    # Histogram counts for all bins
    counts, _ = np.histogram(times, bins=bins)

    # Select only good bins and corresponding counts
    bin_centers_good = bin_centers[good_mask]
    counts_good = counts[good_mask]

    return bin_centers_good, counts_good
Background fitting#
! pip install emcee
import emcee
import multiprocessing
from scipy.optimize import curve_fit
from scipy.special import gammaln
from tqdm import tqdm

def poly3_func(x, a, b, c, d):
    return a * x**3 + b * x**2 + c * x + d

def model(xx, t0, best_params, norm_val):
    return poly3_func(xx - t0, *best_params) * norm_val


def fit_background_linear(bin_centers, counts, t0):

    x = bin_centers
    '''

    Change the following line to define properly the background interval. In this case
    we are using -50s to t0-5s and t0+20s to t0+150s for background fitting.

    '''
    mask = ((x >= t0 - 50) & (x < t0 - 5)) | ((x > t0 + 20) & (x <= t0 + 150))

    x_fit = x[mask]
    counts_fit = counts[mask]
    # Normalize counts by the median of the pre-t0 region for stability
    x0 = x_fit - t0
    norm_val = np.median(counts_fit)
    if norm_val == 0:
        norm_val = 1  # Prevent division by zero
    y = counts_fit / norm_val


    p0 = [0, 0, 0, np.mean(y)]
    popt, _ = curve_fit(poly3_func, x0, y, p0=p0)


    # Prepare data for MCMC: x0, y, and errors
    yerr = np.sqrt(np.abs(y))
    yerr[yerr == 0] = 1.0  # Avoid zero errors

    def log_prior(theta):
        a, b, c, d = theta
        # Wide but reasonable priors
        if popt[0]-10 < a < popt[0]+10 and popt[1]-10 < b < popt[1]+10 and popt[2]-10 < c < popt[2]+10 and 0.1 * popt[3] < d < 10 * popt[3]:
            return 0.0
        return -np.inf

    def log_likelihood(theta, x, y):
        # Poisson log-likelihood for counts data
        model = poly3_func(x, *theta)
        model = np.clip(model, 1e-6, None)  # Avoid log(0)
        # Scale back to original counts
        model_counts = model * norm_val
        y_counts = y * norm_val
        # Use gammaln for log-factorial
        return np.sum(y_counts * np.log(model_counts) - model_counts - gammaln(y_counts + 1))

    def log_probability(theta, x, y):
        lp = log_prior(theta)
        if not np.isfinite(lp):
            return -np.inf
        return lp + log_likelihood(theta, x, y)

    ndim, nwalkers = 4, 32
    # Initial guess near least squares
    p0_ls, _ = curve_fit(poly3_func, x0, y, p0=[0, 0, 0, np.mean(y)])
    p0 = p0_ls + 1e-4 * np.random.randn(nwalkers, ndim)

    ncores = multiprocessing.cpu_count()
    sampler = emcee.EnsembleSampler(nwalkers, ndim, log_probability, args=(x0, y), threads=ncores)
    # Add a progress bar using tqdm
    try:
        nsteps = 1000 # Number of MCMC steps, not so many to avoid long runtimes
        for _ in tqdm(range(nsteps), desc="MCMC sampling"):
            sampler.run_mcmc(p0, 1, progress=False)
            p0 = sampler.get_last_sample().coords
    except ImportError:
        # Fallback to normal run if tqdm is not available
        sampler.run_mcmc(p0, 1000, progress=True)
    samples = sampler.get_chain(discard=200, flat=True)

    # Best fit: parameters with maximum posterior likelihood
    log_probs = np.array([log_probability(theta, x0, y) for theta in samples])
    best_params = samples[np.argmax(log_probs)]

    print( f'Best fit mcmc parameters: {best_params}' )

    return best_params, samples, norm_val
Requirement already satisfied: emcee in /Users/sjs8171/opt/anaconda3/envs/bat/lib/python3.10/site-packages (3.1.6)
Requirement already satisfied: numpy in /Users/sjs8171/opt/anaconda3/envs/bat/lib/python3.10/site-packages (from emcee) (2.0.1)
Search of time seeds for the analysis#
For different time bins, we compute the signal to noise ratio (SNR), knowing the level of background. The formula for each time bin i is
from matplotlib.patches import Patch
def find_seeds(bin_centers, counts, model_bkg, counts_sub, bin_size_ms, t0, workdir, samples, norm_val):
plt.figure(figsize=(15, 5))
x = bin_centers - t0
errors = np.sqrt(counts)
# Find indices where the gap is large
gaps = np.where(np.diff(x) > 1.1*bin_size_ms/1000)[0]
# Split indices into contiguous segments
segments = np.split(np.arange(len(x)), gaps + 1)
# Plot non-background-subtracted light curve (step only)
plt.figure(figsize=(10, 5))
x = bin_centers - t0
for seg in segments:
plt.step(x[seg], counts[seg], where='mid', color='black', alpha=0.6)
# Plot 90% confidence band for background model using MCMC samples
n_samples = 1000
if samples.shape[0] > n_samples:
idx = np.random.choice(samples.shape[0], n_samples, replace=False)
sample_subset = samples[idx]
else:
sample_subset = samples
model_curves = np.array([model(bin_centers, t0, params, norm_val) for params in sample_subset])
lower = np.percentile(model_curves, 5, axis=0)
upper = np.percentile(model_curves, 95, axis=0)
plt.fill_between(x, lower, upper, color='red', alpha=0.2)
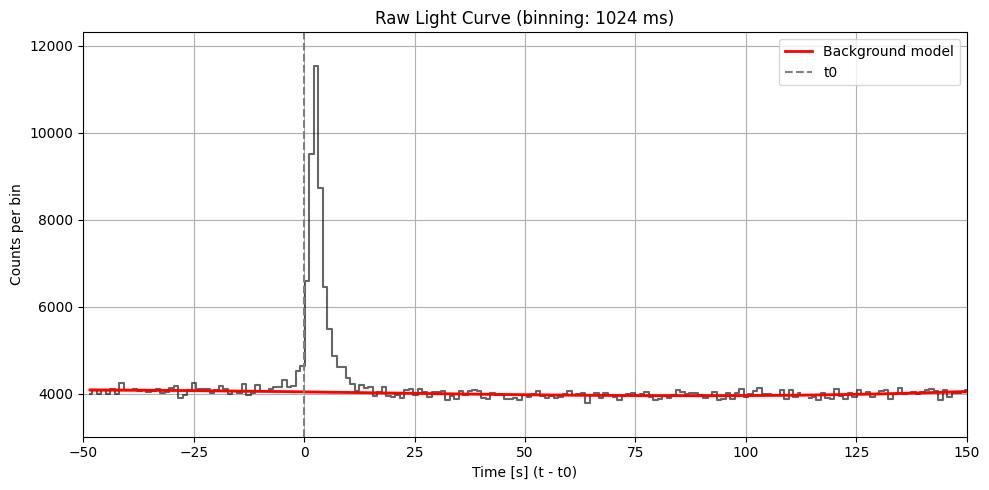
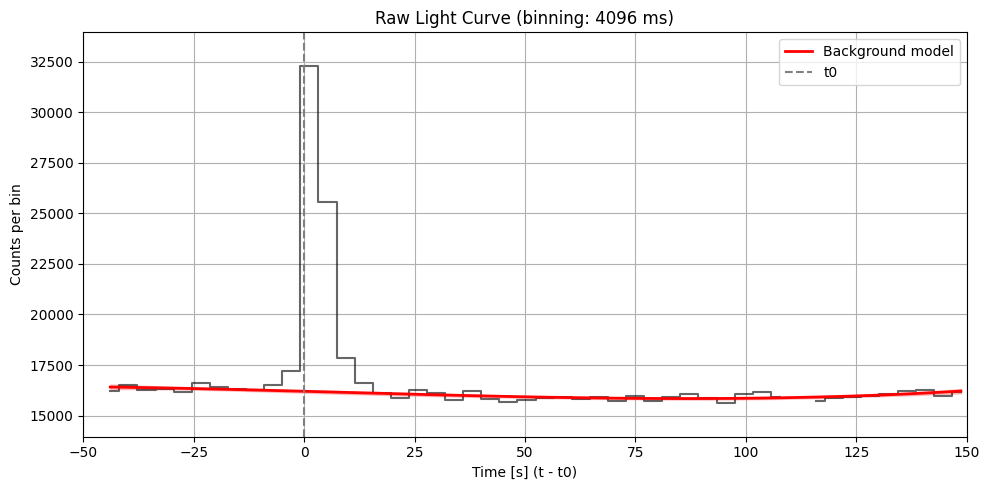
plt.plot(x, model_bkg, color='red', linestyle='-', linewidth=2, label='Background model')
plt.axvline(0, color='gray', linestyle='--', label='t0')
plt.title(f"Raw Light Curve (binning: {bin_size_ms} ms)")
plt.xlabel("Time [s] (t - t0)")
plt.ylabel("Counts per bin")
plt.legend()
plt.grid(True)
tmax = 150
plt.xlim(-50, tmax)
mask = (x >= -50) & (x <= tmax)
ymin, ymax = counts[mask].min(), counts[mask].max()
yrange = ymax - ymin
plt.ylim(ymin - 0.1 * yrange, ymax + 0.1 * yrange)
plt.tight_layout()
plt.show()
plt.savefig(os.path.join(workdir, f"light_curve_raw_{bin_size_ms}ms.png"), dpi=300)
plt.close()
plt.figure(figsize=(15, 5))
for seg in segments:
plt.step(x[seg], counts_sub[seg], where='mid', color='blue', alpha=0.6)
# Overlay error bars
plt.errorbar(x, counts_sub, yerr=errors, fmt='o', color='blue', alpha=0.6, label='BKG-subtracted', markersize=3, capsize=2)
snr = np.zeros_like(counts_sub, dtype=float)
mask = (x < -5) | (x > 20)
if np.any(mask):
bkg_std = np.std(counts_sub[mask])
else:
bkg_std = np.std(counts_sub)
with np.errstate(divide='ignore', invalid='ignore'):
snr = counts_sub / (model_bkg + counts)**0.5
snr[snr < 0] = 0
print(f'Max SNR: {snr.max()}')
# Normalize SNR for colormap (clip at 0, max in window for visualization)
snr_max = snr.max()
snr_clipped = np.clip(snr, 0, snr_max)
cmap = plt.get_cmap('GnBu')
norm = plt.Normalize(0, snr_max)
# Prepare to add legend for hatching
hatch_legend_added = False
double_hatch_legend_added = False
for i, xc in enumerate(x):
color = cmap(norm(snr_clipped[i]))
if snr[i] > 3.5:
plt.axvspan(
xc - bin_size_ms/2000.0,
xc + bin_size_ms/2000.0,
color=color,
alpha=0.3,
zorder=1,
label='SNR > 3.5' if not hatch_legend_added else None
)
hatch_legend_added = True
# No shading for SNR <= 3.5
# Add custom legend handles for hatching if not present
handles, labels = plt.gca().get_legend_handles_labels()
if 'SNR > 3.5' not in labels:
handles.append(Patch(facecolor='none', edgecolor='black', hatch='/', label='SNR > 3.5'))
plt.legend(handles=handles, labels=[h.get_label() for h in handles])
# Add color bar for SNR
sm = plt.cm.ScalarMappable(cmap=cmap, norm=norm)
sm.set_array([])
ax = plt.gca()
cbar = plt.colorbar(sm, pad=0.01, ax=ax, alpha=0.3)
cbar.set_label('SNR')
# Highlight spikes
# for spike_center in bin_centers[spikes[0]]:
# spike_x = spike_center - t0
# plt.axvspan(spike_x - bin_size_ms/2000.0, spike_x + bin_size_ms/2000.0, color='red', alpha=0.3, label='Spikes' if 'Spikes' not in plt.gca().get_legend_handles_labels()[1] else None, zorder=4)
plt.title(f"Light Curve (binning: {bin_size_ms} ms)")
plt.xlabel("Time [s] (t - t0)")
plt.ylabel("Counts per bin")
plt.axhline(0, color='gray', linestyle=':', linewidth=1)
max_snr_val = snr.max()
max_snr_idx = np.where(snr == max_snr_val)[0][0]
t_star = bin_centers[max_snr_idx] - t0 # Time of maximum SNR
window = min(45, 30 * bin_size_ms / 1000.0) # Set window size based on bin size
plt.xlim(t_star - window, t_star + window)
mask = (x >= -window) & (x <= window)
# Add horizontal bands for 3.5 and 5 sigma of background
plt.axhspan(-3.5 * bkg_std, 3.5 * bkg_std, color='blue', alpha=0.1)
plt.axhspan(-5 * bkg_std, 5 * bkg_std, color='blue', alpha=0.1, label='3.5σ and 5σ')
plt.autoscale(axis='y')
plt.legend()
plt.tight_layout()
plt.show()
plt.savefig(os.path.join(workdir, f"light_curve_{bin_size_ms}ms.png"), dpi=300)
if max_snr_val > 4.0:
return bin_centers[max_snr_idx] - t0, max_snr_val
return None, None
def cust_seeds(t0, workdir):

    filename = os.path.join(workdir, 'filter_evdata.fits')
    #filename = str(event.event_files) # uncomment this to check what happens with the non-filtered event file
    event_times, gti_start, gti_stop = load_event_times(filename)

    snr_max = 0
    seed_max = None
    seeds = []


    for bin_size_ms in [64, 512, 1024, 4096]:

        try:
            bin_size = bin_size_ms / 1000.0
            bin_centers, counts = bin_light_curve(event_times, bin_size, gti_start, gti_stop, t0)
            if len(bin_centers) < 20:
                logging.info(f'Not enough bins for bin size {bin_size_ms} ms, skipping...')
                continue

            best_params, samples, norm_val  = fit_background_linear(bin_centers, counts, t0)
            model_bkg = model(bin_centers, t0, best_params, norm_val)

            counts_sub = counts - model_bkg

            # Detect spikes
            time_bin, snr_bin = find_seeds(bin_centers, counts, model_bkg, counts_sub, bin_size_ms, t0, workdir, samples, norm_val)
            print(f'Bin size: {bin_size_ms} ms, Seed time: {time_bin}, SNR: {snr_bin}', flush=True)
            if time_bin is not None or snr_bin is not None:
                if snr_bin > 4.0:
                    seeds.append([time_bin, bin_size_ms, snr_bin])
                if snr_bin > snr_max:
                    seed_max, dur_max, snr_max = time_bin, bin_size_ms, snr_bin
        except Exception as e:
            # logging.error(f'Error processing bin size {bin_size_ms} ms: {traceback.format_exc()}')
            continue
    print(f'Max SNR: {snr_max} found at time {seed_max} with duration {dur_max} ms', flush=True)
cust_seeds(t0, workdir)
MCMC sampling: 100%|██████████| 1000/1000 [00:04<00:00, 218.42it/s]
Best fit mcmc parameters: [ 2.18579754e-08 -9.85098852e-07 -3.31733104e-04 1.01221607e+00]
<Figure size 1500x500 with 0 Axes>
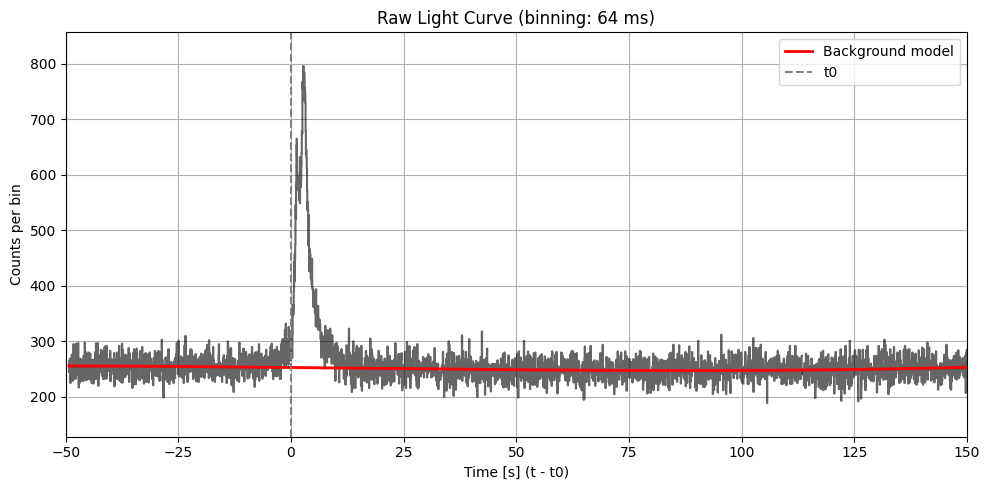
Max SNR: 16.77222143278643
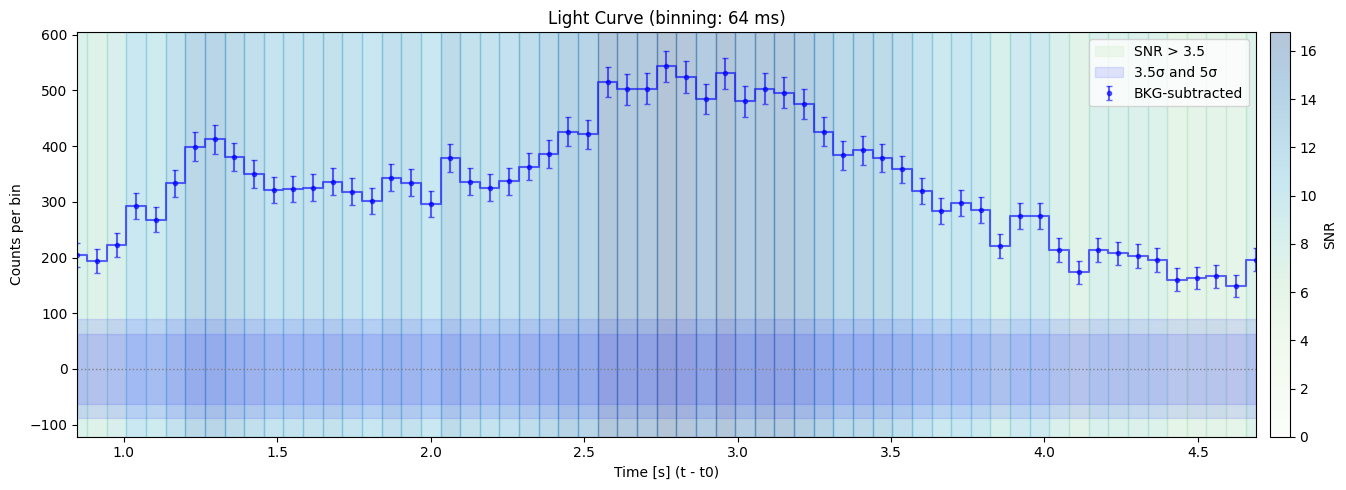
Bin size: 64 ms, Seed time: 2.768008589744568, SNR: 16.77222143278643
MCMC sampling: 100%|██████████| 1000/1000 [00:01<00:00, 725.08it/s]
Best fit mcmc parameters: [ 2.38927431e-08 -1.32306375e-06 -3.25579603e-04 1.01024361e+00]
<Figure size 640x480 with 0 Axes>
<Figure size 1500x500 with 0 Axes>
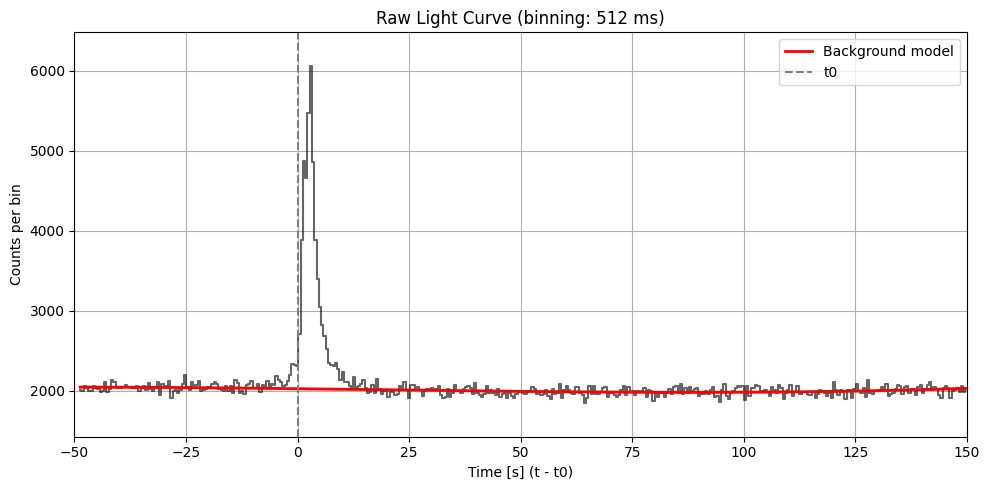
Max SNR: 44.91156638236836
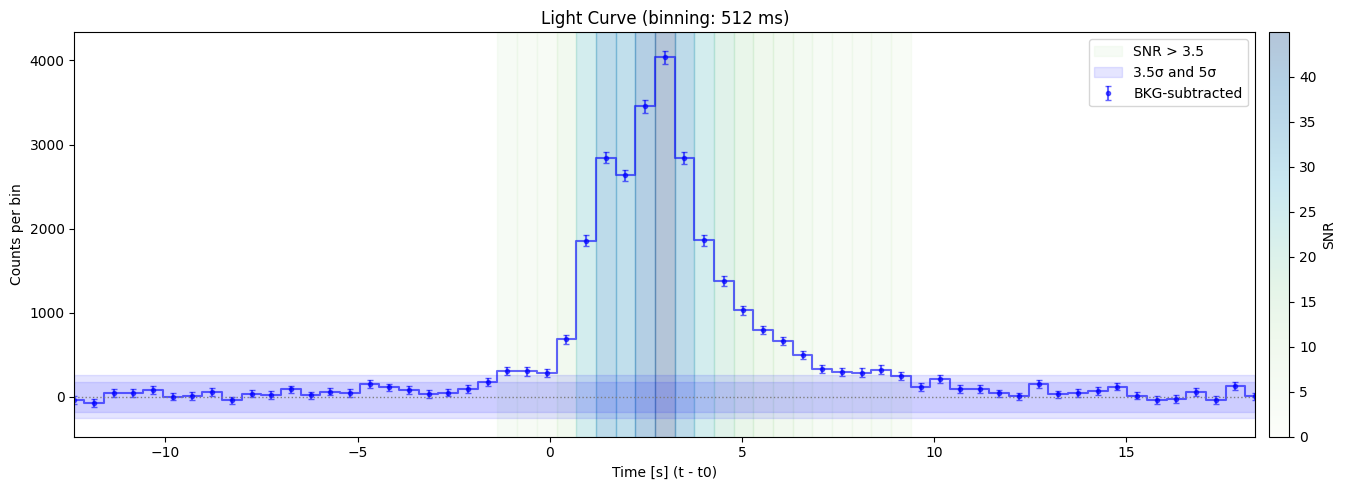
Bin size: 512 ms, Seed time: 2.99199640750885, SNR: 44.91156638236836
MCMC sampling: 100%|██████████| 1000/1000 [00:01<00:00, 846.45it/s]
Best fit mcmc parameters: [ 2.25026109e-08 -1.08614546e-06 -3.29412154e-04 1.00947346e+00]
<Figure size 640x480 with 0 Axes>
<Figure size 1500x500 with 0 Axes>
Max SNR: 60.02731180359651
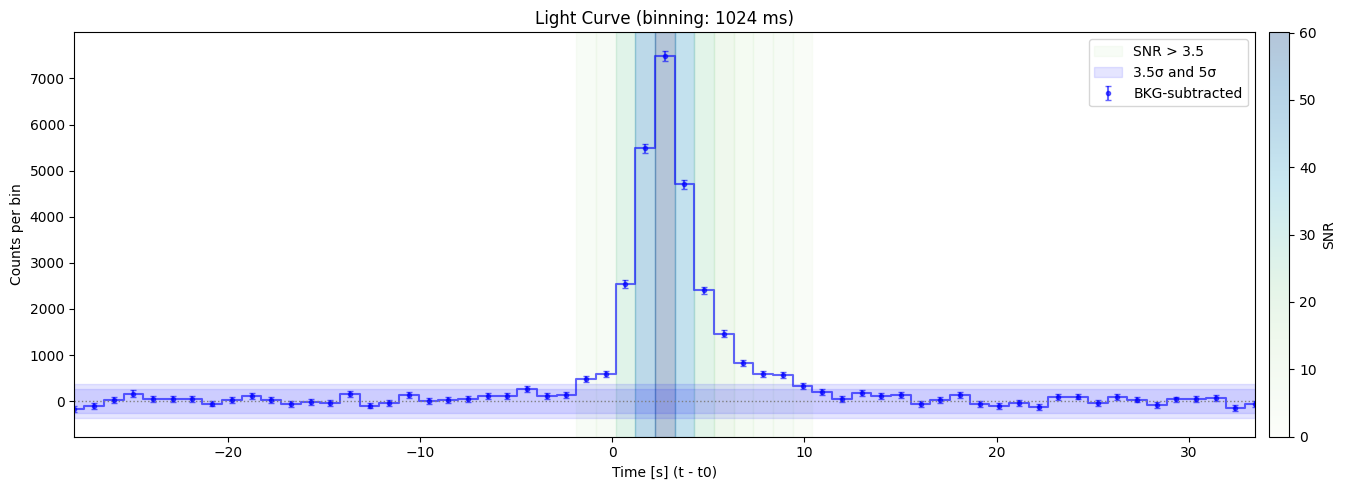
Bin size: 1024 ms, Seed time: 2.7360024452209473, SNR: 60.02731180359651
MCMC sampling: 100%|██████████| 1000/1000 [00:00<00:00, 1007.14it/s]
Best fit mcmc parameters: [ 2.06219305e-08 -5.88004768e-07 -3.63975838e-04 1.01446877e+00]
<Figure size 640x480 with 0 Axes>
<Figure size 1500x500 with 0 Axes>
Max SNR: 73.10897379848099
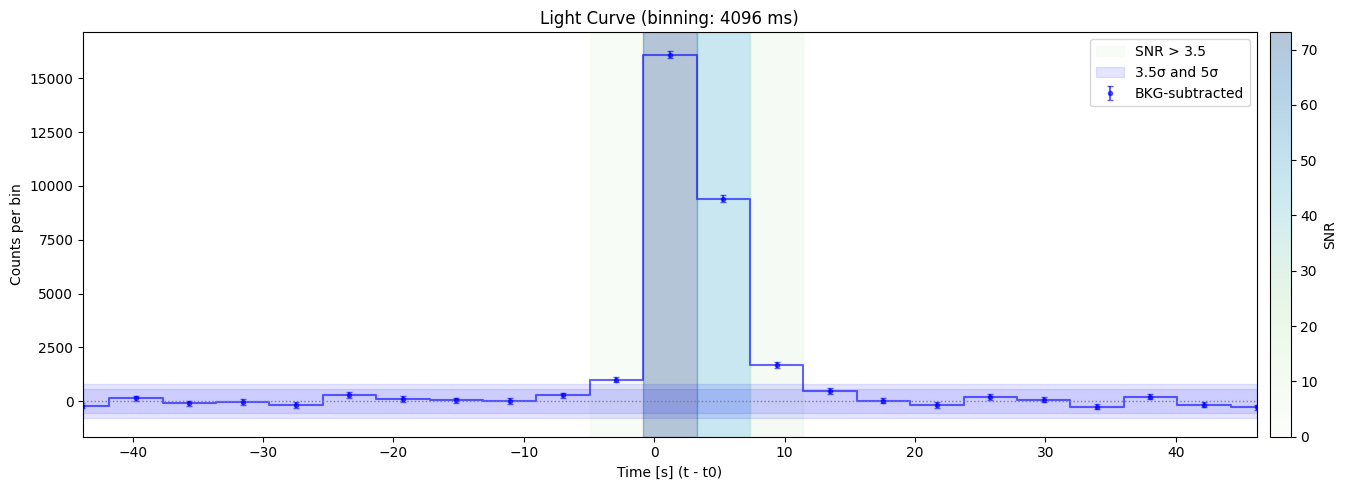
Bin size: 4096 ms, Seed time: 1.199999451637268, SNR: 73.10897379848099
Max SNR: 73.10897379848099 found at time 1.199999451637268 with duration 4096 ms
<Figure size 640x480 with 0 Axes>
Mosaic#
def log_mosaic(mosaic_detected_sources):
    try:
        _mosaic_table_header = "{:<3} {:>10} {:>10} {:>10} {:>20}".format(
        "Idx", "SNR", "RA", "DEC", "psffwhm_separation"
        )
        _mosaic_table_rows = []
        if mosaic_detected_sources is not None:
            for _mosaic_idx, _mosaic_src in enumerate(mosaic_detected_sources):
                _mosaic_snr = _mosaic_src.get('SNR', None)
                _mosaic_coord = _mosaic_src.get('SNR_skycoord', None)
                _mosaic_ra = f"{_mosaic_coord.ra.deg:10.3f}" if _mosaic_coord is not None else "   None"
                _mosaic_dec = f"{_mosaic_coord.dec.deg:10.3f}" if _mosaic_coord is not None else "   None"
                _mosaic_psf_sep = f"{_mosaic_src.get('psffwhm_separation', None):20.3f}" if _mosaic_src.get('psffwhm_separation', None) is not None else "        None"
                _mosaic_table_rows.append(
                    "{:<3} {:>10} {} {} {}".format(
                    _mosaic_idx,
                    f"{_mosaic_snr:10.3f}" if _mosaic_snr is not None else "     None",
                    _mosaic_ra,
                    _mosaic_dec,
                    _mosaic_psf_sep
                    )
                )
            _mosaic_table_str = "\n".join([_mosaic_table_header] + _mosaic_table_rows)
            # print(_mosaic_table_str)
            logging.info("Mosaic detected sources (SNR, coords, psffwhm_separation):\n" + _mosaic_table_str)
        else:
            logging.info("No mosaic detected sources found.")
    except Exception as _mosaic_exc:
        logging.error(f"Error logging detected sources table: {traceback.format_exc()}")
time_bins = np.arange(1, 3, 0.2)*u.s
energybins = [15, 350]*u.keV
skyview_nprocs = 10
healpix_nside = 512
mosaic_nprocs = 10

import os
from joblib import parallel_backend

joblib_tmp = os.path.join(workdir, "joblib_tmp")
os.makedirs(joblib_tmp, exist_ok=True)
os.environ["JOBLIB_TEMP_FOLDER"] = joblib_tmp

n_procs = 10

with parallel_backend(
    'loky',
    n_jobs=n_procs,
    max_nbytes=None,
    inner_max_num_threads=1,
    temp_folder=joblib_tmp
):

    slew_skyviews=ba.parallel.create_event_skyview(event, timebins=time_bins, energybins=energybins,
                                                recalc = True, is_relative=True, parse_images = False,
                                                T0=t0, nprocs=skyview_nprocs,
                                                input_dict=dict(aperture="CALDB:DETECTION", pcodethresh=0.01))

    mosaic_skyview = ba.parallel.mosaic_skyview(slew_skyviews, healpix_nside=healpix_nside,
                                                healpix_coordsys="icrs", nprocs=mosaic_nprocs)
mosaic_detected_sources = mosaic_skyview.detect_sources(input_dict=dict(pcodethresh=0.01, snrthresh=5.5))
WARNING: FITSFixedWarning: 'datfix' made the change 'Invalid parameter values: MJD-OBS and DATE-OBS are inconsistent'. [astropy.wcs.wcs]
WARNING: FITSFixedWarning: 'datfix' made the change 'Invalid parameter values: MJD-OBS and DATE-OBS are inconsistent'. [astropy.wcs.wcs]
WARNINGWARNING: FITSFixedWarning: 'datfix' made the change 'Invalid parameter values: MJD-OBS and DATE-OBS are inconsistent'. [astropy.wcs.wcs]: FITSFixedWarning: 'datfix' made the change 'Invalid parameter values: MJD-OBS and DATE-OBS are inconsistent'. [astropy.wcs.wcs]

WARNING: FITSFixedWarning: 'datfix' made the change 'Invalid parameter values: MJD-OBS and DATE-OBS are inconsistent'. [astropy.wcs.wcs]
WARNING: FITSFixedWarning: 'datfix' made the change 'Invalid parameter values: MJD-OBS and DATE-OBS are inconsistent'. [astropy.wcs.wcs]
WARNING: FITSFixedWarning: RADECSYS= 'FK5 '
the RADECSYS keyword is deprecated, use RADESYSa. [astropy.wcs.wcs]
WARNING: FITSFixedWarning: 'datfix' made the change 'Set DATEREF to '2001-01-01T00:01:04.184' from MJDREF.
Invalid parameter values: MJD-OBS and DATE-OBS are inconsistent.
Set MJD-END to 59401.347708 from DATE-END'. [astropy.wcs.wcs]
WARNING: FITSFixedWarning: 'datfix' made the change 'Invalid parameter values: MJD-OBS and DATE-OBS are inconsistent'. [astropy.wcs.wcs]
WARNING: FITSFixedWarning: RADECSYS= 'FK5 '
the RADECSYS keyword is deprecated, use RADESYSa. [astropy.wcs.wcs]
WARNING: FITSFixedWarning: 'datfix' made the change 'Set DATEREF to '2001-01-01T00:01:04.184' from MJDREF.
Invalid parameter values: MJD-OBS and DATE-OBS are inconsistent.
Set MJD-END to 59401.347708 from DATE-END'. [astropy.wcs.wcs]
WARNING: FITSFixedWarning: RADECSYS= 'FK5 '
the RADECSYS keyword is deprecated, use RADESYSa. [astropy.wcs.wcs]
WARNING: FITSFixedWarning: RADECSYS= 'FK5 '
the RADECSYS keyword is deprecated, use RADESYSa. [astropy.wcs.wcs]
WARNING: FITSFixedWarning: RADECSYS= 'FK5 '
the RADECSYS keyword is deprecated, use RADESYSa. [astropy.wcs.wcs]
WARNING: FITSFixedWarning: RADECSYS= 'FK5 '
the RADECSYS keyword is deprecated, use RADESYSa. [astropy.wcs.wcs]
WARNING: FITSFixedWarning: 'datfix' made the change 'Set DATEREF to '2001-01-01T00:01:04.184' from MJDREF.
Invalid parameter values: MJD-OBS and DATE-OBS are inconsistent.
Set MJD-END to 59401.347708 from DATE-END'. [astropy.wcs.wcs]
WARNING: FITSFixedWarning: 'datfix' made the change 'Set DATEREF to '2001-01-01T00:01:04.184' from MJDREF.
Invalid parameter values: MJD-OBS and DATE-OBS are inconsistent.
Set MJD-END to 59401.347708 from DATE-END'. [astropy.wcs.wcs]
WARNING: FITSFixedWarning: 'datfix' made the change 'Set DATEREF to '2001-01-01T00:01:04.184' from MJDREF.
Invalid parameter values: MJD-OBS and DATE-OBS are inconsistent.
Set MJD-END to 59401.347708 from DATE-END'. [astropy.wcs.wcs]
WARNING: FITSFixedWarning: 'datfix' made the change 'Set DATEREF to '2001-01-01T00:01:04.184' from MJDREF.
Invalid parameter values: MJD-OBS and DATE-OBS are inconsistent.
Set MJD-END to 59401.347708 from DATE-END'. [astropy.wcs.wcs]
/Users/sjs8171/opt/anaconda3/envs/bat/lib/python3.10/site-packages/astropy/units/decorators.py:313: UserWarning: No astropy World Coordinate System has been specified the sky image is assumed to be in the detector tangent plane. No conversion to Healpix or RA/Dec & galactic coordinate systems will be possible.
/Users/sjs8171/opt/anaconda3/envs/bat/lib/python3.10/site-packages/astropy/units/decorators.py:313: UserWarning: No astropy World Coordinate System has been specified the sky image is assumed to be in the detector tangent plane. No conversion to Healpix or RA/Dec & galactic coordinate systems will be possible.
/Users/sjs8171/opt/anaconda3/envs/bat/lib/python3.10/site-packages/astropy/units/decorators.py:313: UserWarning: No astropy World Coordinate System has been specified the sky image is assumed to be in the detector tangent plane. No conversion to Healpix or RA/Dec & galactic coordinate systems will be possible.
/Users/sjs8171/opt/anaconda3/envs/bat/lib/python3.10/site-packages/astropy/units/decorators.py:313: UserWarning: No astropy World Coordinate System has been specified the sky image is assumed to be in the detector tangent plane. No conversion to Healpix or RA/Dec & galactic coordinate systems will be possible.
/Users/sjs8171/opt/anaconda3/envs/bat/lib/python3.10/site-packages/astropy/units/decorators.py:313: UserWarning: No astropy World Coordinate System has been specified the sky image is assumed to be in the detector tangent plane. No conversion to Healpix or RA/Dec & galactic coordinate systems will be possible.
/Users/sjs8171/opt/anaconda3/envs/bat/lib/python3.10/site-packages/astropy/units/decorators.py:313: UserWarning: No astropy World Coordinate System has been specified the sky image is assumed to be in the detector tangent plane. No conversion to Healpix or RA/Dec & galactic coordinate systems will be possible.
/Users/sjs8171/opt/anaconda3/envs/bat/lib/python3.10/site-packages/astropy/units/decorators.py:313: UserWarning: No astropy World Coordinate System has been specified the sky image is assumed to be in the detector tangent plane. No conversion to Healpix or RA/Dec & galactic coordinate systems will be possible.
/Users/sjs8171/opt/anaconda3/envs/bat/lib/python3.10/site-packages/astropy/units/decorators.py:313: UserWarning: No astropy World Coordinate System has been specified the sky image is assumed to be in the detector tangent plane. No conversion to Healpix or RA/Dec & galactic coordinate systems will be possible.
/Users/sjs8171/opt/anaconda3/envs/bat/lib/python3.10/site-packages/astropy/units/decorators.py:313: UserWarning: No astropy World Coordinate System has been specified the sky image is assumed to be in the detector tangent plane. No conversion to Healpix or RA/Dec & galactic coordinate systems will be possible.
/Users/sjs8171/opt/anaconda3/envs/bat/lib/python3.10/site-packages/astropy/units/decorators.py:313: UserWarning: No astropy World Coordinate System has been specified the sky image is assumed to be in the detector tangent plane. No conversion to Healpix or RA/Dec & galactic coordinate systems will be possible.
/Users/sjs8171/opt/anaconda3/envs/bat/lib/python3.10/site-packages/astropy/units/decorators.py:313: UserWarning: No astropy World Coordinate System has been specified the sky image is assumed to be in the detector tangent plane. No conversion to Healpix or RA/Dec & galactic coordinate systems will be possible.
/Users/sjs8171/opt/anaconda3/envs/bat/lib/python3.10/site-packages/astropy/units/decorators.py:313: UserWarning: No astropy World Coordinate System has been specified the sky image is assumed to be in the detector tangent plane. No conversion to Healpix or RA/Dec & galactic coordinate systems will be possible.
/Users/sjs8171/opt/anaconda3/envs/bat/lib/python3.10/site-packages/astropy/units/decorators.py:313: UserWarning: No astropy World Coordinate System has been specified the sky image is assumed to be in the detector tangent plane. No conversion to Healpix or RA/Dec & galactic coordinate systems will be possible.
/Users/sjs8171/opt/anaconda3/envs/bat/lib/python3.10/site-packages/astropy/units/decorators.py:313: UserWarning: No astropy World Coordinate System has been specified the sky image is assumed to be in the detector tangent plane. No conversion to Healpix or RA/Dec & galactic coordinate systems will be possible.
/Users/sjs8171/opt/anaconda3/envs/bat/lib/python3.10/site-packages/astropy/units/decorators.py:313: UserWarning: No astropy World Coordinate System has been specified the sky image is assumed to be in the detector tangent plane. No conversion to Healpix or RA/Dec & galactic coordinate systems will be possible.
/Users/sjs8171/opt/anaconda3/envs/bat/lib/python3.10/site-packages/astropy/units/decorators.py:313: UserWarning: No astropy World Coordinate System has been specified the sky image is assumed to be in the detector tangent plane. No conversion to Healpix or RA/Dec & galactic coordinate systems will be possible.
/Users/sjs8171/opt/anaconda3/envs/bat/lib/python3.10/site-packages/astropy/units/decorators.py:313: UserWarning: No astropy World Coordinate System has been specified the sky image is assumed to be in the detector tangent plane. No conversion to Healpix or RA/Dec & galactic coordinate systems will be possible.
/Users/sjs8171/opt/anaconda3/envs/bat/lib/python3.10/site-packages/astropy/units/decorators.py:313: UserWarning: No astropy World Coordinate System has been specified the sky image is assumed to be in the detector tangent plane. No conversion to Healpix or RA/Dec & galactic coordinate systems will be possible.
/Users/sjs8171/opt/anaconda3/envs/bat/lib/python3.10/site-packages/astropy/units/decorators.py:313: UserWarning: No astropy World Coordinate System has been specified the sky image is assumed to be in the detector tangent plane. No conversion to Healpix or RA/Dec & galactic coordinate systems will be possible.
/Users/sjs8171/opt/anaconda3/envs/bat/lib/python3.10/site-packages/astropy/units/decorators.py:313: UserWarning: No astropy World Coordinate System has been specified the sky image is assumed to be in the detector tangent plane. No conversion to Healpix or RA/Dec & galactic coordinate systems will be possible.
/Users/sjs8171/opt/anaconda3/envs/bat/lib/python3.10/site-packages/astropy/units/decorators.py:313: UserWarning: No astropy World Coordinate System has been specified the sky image is assumed to be in the detector tangent plane. No conversion to Healpix or RA/Dec & galactic coordinate systems will be possible.
/Users/sjs8171/opt/anaconda3/envs/bat/lib/python3.10/site-packages/astropy/units/decorators.py:313: UserWarning: No astropy World Coordinate System has been specified the sky image is assumed to be in the detector tangent plane. No conversion to Healpix or RA/Dec & galactic coordinate systems will be possible.
/Users/sjs8171/opt/anaconda3/envs/bat/lib/python3.10/site-packages/astropy/units/decorators.py:313: UserWarning: No astropy World Coordinate System has been specified the sky image is assumed to be in the detector tangent plane. No conversion to Healpix or RA/Dec & galactic coordinate systems will be possible.
/Users/sjs8171/opt/anaconda3/envs/bat/lib/python3.10/site-packages/astropy/units/decorators.py:313: UserWarning: No astropy World Coordinate System has been specified the sky image is assumed to be in the detector tangent plane. No conversion to Healpix or RA/Dec & galactic coordinate systems will be possible.
log_mosaic(mosaic_detected_sources)
2025-12-18 15:07:59,236 - INFO - Mosaic detected sources (SNR, coords, psffwhm_separation):
Idx        SNR         RA        DEC   psffwhm_separation
0       35.908    311.924     13.401               12.001
1       32.670    312.012     13.325               11.808
2       32.613    311.836     13.325               12.258
3       30.800    311.924     13.248               12.069
4       23.265    312.012     13.478               11.745
5       22.182    311.836     13.478               12.198
6       20.196    312.100     13.401               11.549
7       19.681    311.748     13.401               12.453
8       17.514    312.100     13.248               11.619
9       17.428    311.748     13.248               12.519
10      17.418    312.012     13.171               11.884
11      16.851    311.836     13.171               12.332
12      15.191    311.924     13.555               11.946
13      10.354    311.660     13.325               12.710
14      10.083    312.187     13.325               11.357
15       9.795    311.924     13.095               12.150
16       8.345    312.100     13.555               11.493
17       7.464    311.748     13.555               12.400
18       6.979    312.187     13.478               11.293
19       6.288    311.660     13.478               12.651
20       6.277    312.012     13.632               11.697
21       5.764    311.836     13.632               12.152
22       5.571    312.100     13.095               11.703
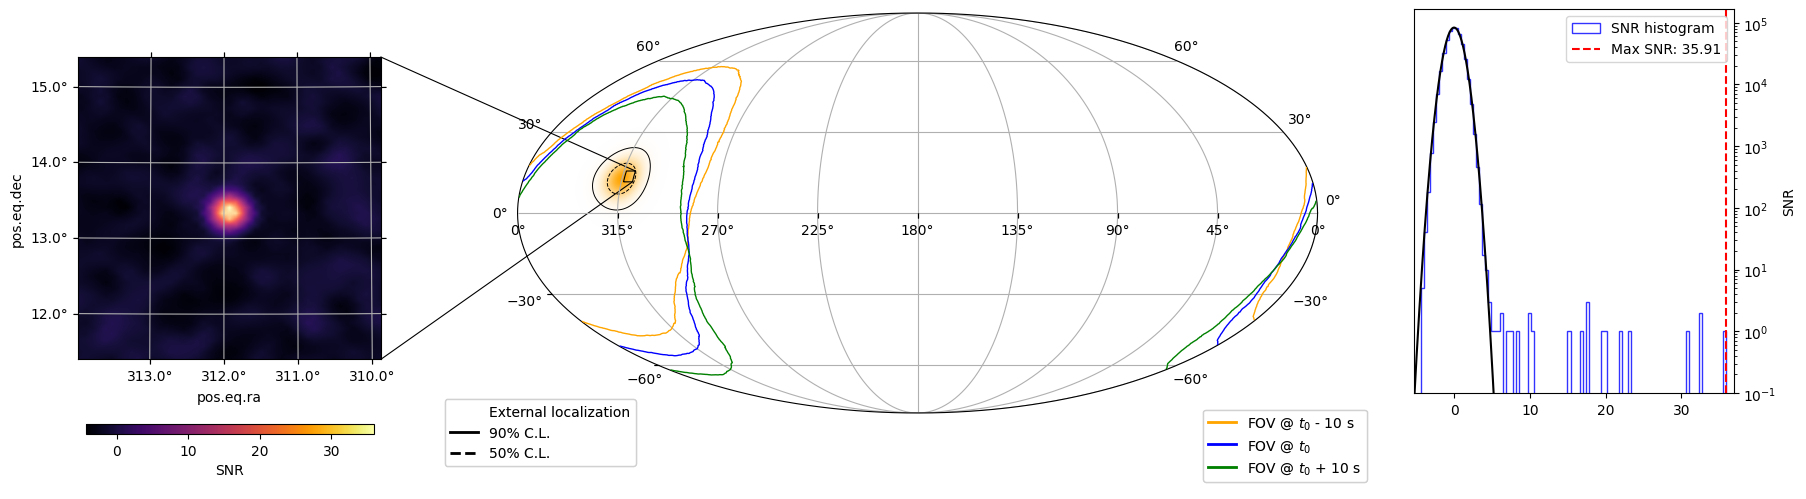
Plot the results#
from matplotlib.lines import Line2D
from astropy.modeling.models import Gaussian1D

def map_mosaic(ra_s, dec_s, workdir, skyview):

    fig = plt.figure()

    ax_zoom_rect = plt.axes([-1.2, 0.0, 0.9, 0.9],projection='astro degrees zoom',
                center=f'{ra_s}d {dec_s}d', radius='2 deg')


    ax_globe = plt.axes(
        [-0.3, -0.05, 1.25, 1.25],
        projection='astro degrees mollweide',
        )

    ax_globe.grid()

    ax_hist = fig.add_axes([1.1, 0.2, 0.5, 0.8])  # [left, bottom, width, height]


    '''
    The hp_proj object contains the healpix projection of the sky image.
    It is an array that contains [time, sky pixel, energy band].
    Since we created a single sky image for a single time bin and a single energy band,
    we can extract the first time and first energy band to get the sky map.
    '''
    t = skyview.snr_img # loading the sky image already done outside
    hp_proj = t.healpix_projection(coordsys="icrs", nside=healpix_nside) # projecting in healpix (from detector coords to sky coords)

    snr_map = hp_proj.contents[0,:,0]
    ax_zoom_rect.imshow_hpx((snr_map, 'ICRS'),  cmap="magma", alpha=1.0, zorder=1)

    '''
    We load again the partial coding image to overplot the contours
    '''

    col = ['orange', 'blue', 'green']

    time_bins=[[-10,-9],[-1,+1],[10,11]]*u.s
    for n in range(0,3):
        settled_skyview = event.create_skyview(timebins=time_bins[n], energybins= [15, 350]*u.keV, is_relative=True, T0=t0)
        x = settled_skyview.pcode_img.healpix_projection(coordsys="icrs", nside=1024).contents[0,:,0]
        ax_globe.contour_hpx((x, 'ICRS'), nested=False, colors=col[n], levels=[0.1], linewidths=1, zorder=2)


    '''
    We finally create the histogram of the SNR values
    '''

    h = skyview.snr_img.contents.flatten()
    val, _, _=plt.hist(h, bins=100, alpha=0.8, color='blue', label='SNR histogram', histtype='step')

    max_snr_value = np.nanmax(h)
    min_snr_value = np.nanmin(h)
    ax_hist.axvline(max_snr_value, color='red', linestyle='--', label=f'Max SNR: {max_snr_value:.2f}')

    g = Gaussian1D(amplitude=val.max(), stddev=1)
    x = np.arange(-30, 30, .01)
    ax_hist.plot(x, g(x), 'k-')

    # Here some aestethic adjustments

    ax_zoom_rect.coords[0].set_major_formatter('d.d')  # 3 decimal degrees
    ax_zoom_rect.coords[1].set_major_formatter('d.d')  # 3 decimal degrees
    ax_zoom_rect.grid()
    vmin= np.nanmin(snr_map)
    vmax=np.nanmax(snr_map)
    cmap_custom = plt.cm.inferno
    norm = plt.Normalize(vmin=vmin, vmax=vmax)
    sm = plt.cm.ScalarMappable(cmap=cmap_custom, norm=norm)
    cbar = plt.colorbar(sm, ax=ax_zoom_rect, shrink=0.5, orientation='horizontal', aspect=30, pad=0.15)
    cbar.mappable.set_clim(vmin=vmin,vmax=vmax)
    cbar.set_label('SNR')

    ax_globe.grid()
    ax_globe.mark_inset_axes(ax_zoom_rect)
    ax_globe.connect_inset_axes(ax_zoom_rect, 'upper right')
    ax_globe.connect_inset_axes(ax_zoom_rect, 'lower right')


    ax_hist.set_xlabel('')
    ax_hist.set_ylabel('Counts')
    ax_hist.set_ylabel('SNR')
    ax_hist.set_yscale('log')
    ax_hist.yaxis.tick_right()
    ax_hist.yaxis.set_label_position("right")
    ax_hist.set_ylim([0.1,2*val.max()])
    ax_hist.set_xlim([min_snr_value-1,max_snr_value+1])
    ax_hist.legend(
        loc='upper right')


    fov_line = [Line2D([0], [0], color='orange', linestyle='solid', linewidth=2, label='FOV @ $t_0$ - 10 s' ),
    Line2D([0], [0], color='blue', linestyle='solid', linewidth=2, label='FOV @ $t_0$'),
    Line2D([0], [0], color='green', linestyle='solid', linewidth=2, label='FOV @ $t_0$ + 10 s')]


    fit_file = next((fname for fname in os.listdir(workdir) if 'ext_loc' in fname), None)
    loc_handles = None
    if fit_file:
        loc_handles = map_ext(fit_file, workdir, ax_globe)


    if loc_handles is not None:
        leg_ext = ax_globe.legend(handles=loc_handles, loc='lower left', frameon=True, bbox_to_anchor=(-0.1, -0.15), borderaxespad=0.5)
        ax_globe.add_artist(leg_ext)

    ax_leg_bot = fig.add_axes([0.76, 0.0, 0.22, 0.28])
    ax_leg_bot.axis('off')

    fov_legend = ax_leg_bot.legend(handles=fov_line, loc='lower left', frameon=True, borderaxespad=0.5)
    ax_leg_bot.add_artist(fov_legend)

    plt.savefig(os.path.join(workdir,'map_mosaic.png'), bbox_inches='tight', dpi=300)
    plt.show()
    plt.close()
ra_mos, dec_mos = mosaic_detected_sources[0]['SNR_skycoord'].ra.deg, mosaic_detected_sources[0]['SNR_skycoord'].dec.deg

map_mosaic(ra_mos, dec_mos, workdir, mosaic_skyview)
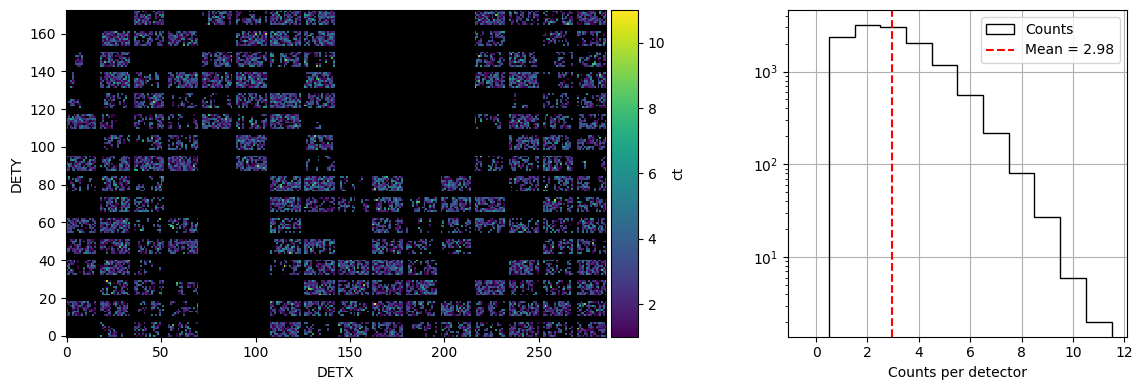
Looking at the DPI#
from mpl_toolkits.axes_grid1 import make_axes_locatable


def plot_dpi(self, mask_value = None, emin=None, emax=None, tmin=None, tmax=None, plot_rate=False):
        """
        This method allows the user to conveniently plot the histogram for a single energy bin and time interval.
        Any detectors with 0 counts (due to detectors being off or due to there being no detectors in the specified
        DETX and DETY coordinates) are blacked out.

        By default, the histogram is binned along the energy and time axes. This behavior can be changed by specifying
        emin/emax and/or tmin/tmax. These values should all exist in the ebins and tbins attributes.

        :param emin: None or an astropy Quantity array of the beginning of the energy bins
        :param emax: None or an astropy Quantity array of the end of the energy bins
        :param tmin: None or an astropy Quantity array of the starting time bin edges that the histogram will be
            rebinned into
        :param tmax: None or an astropy Quantity array of the end time bin edges that the histogram will be
            rebinned into
        :param plot_rate: Boolean to denote if the count rate should be plotted. The histogram gets divided by the
            exposure time of the plotted histogram
        :return: matplotlib figure and axis for the plotted histogram
        """

        if emin is None and emax is None:
            plot_emin = self.ebins["E_MIN"].min()
            plot_emax = self.ebins["E_MAX"].max()
        elif emin is not None and emax is not None:
            plot_emin = emin
            plot_emax = emax
        else:
            raise ValueError(
                "emin and emax must either both be None or both be specified."
            )
        plot_e_idx = np.where(
            (self.ebins["E_MIN"] >= plot_emin) & (self.ebins["E_MAX"] <= plot_emax)
        )[0]

        if tmin is None and tmax is None:
            plot_tmin = self.tbins["TIME_START"].min()
            plot_tmax = self.tbins["TIME_STOP"].max()
        elif tmin is not None and tmax is not None:
            plot_tmin = tmin
            plot_tmax = tmax
        else:
            raise ValueError(
                "tmin and tmax must either both be None or both be specified."
            )
        plot_t_idx = np.where(
            (self.tbins["TIME_START"] >= plot_tmin)
            & (self.tbins["TIME_STOP"] <= plot_tmax)
        )[0]

        # now start to accumulate the DPH counts based on the time and energy range that we care about
        plot_data = self.contents[plot_t_idx, :, :, :]

        if len(plot_t_idx) > 0:
            plot_data = plot_data.sum(axis=0)
        else:
            raise ValueError(
                f"There are no DPH time bins that fall between {plot_tmin} and {plot_tmax}"
            )

        plot_data = plot_data[:, :, plot_e_idx]

        if len(plot_e_idx) > 0:
            plot_data = plot_data.sum(axis=-1)
        else:
            raise ValueError(
                f"There are no DPH energy bins that fall between {plot_emin} and {plot_emax}"
            )

        if plot_rate:
            # calcualte the totoal exposure
            exposure_tot = np.sum(self.exposure[plot_t_idx])
            plot_data /= exposure_tot

        # set any 0 count detectors to nan so they get plotted in black
        # this includes detectors that are off and "space holders" between detectors where the value is 0
        plot_data[plot_data == 0] = np.nan

        mask = (plot_data.value < mask_value[0]) | (plot_data.value > mask_value[1])
        plot_data[mask] = np.nan

        data = plot_data.flatten()
        data = data[data != 0]
        data = data.value

        # Create the figure with two subplots: main image and histogram
        fig, (ax, ax_hist) = plt.subplots(
            1, 2,
            figsize=(12, 5),  # wider figure
            gridspec_kw={'width_ratios': [4, 2]}  # more space for histogram
        )

        # Main image panel
        divider = make_axes_locatable(ax)
        cax = divider.append_axes("right", size="5%", pad=0.05)

        cmap = plt.colormaps.get_cmap("viridis")
        cmap.set_bad(color="k")

        im = ax.imshow(plot_data.value, origin="lower", interpolation="none", cmap=cmap)
        fig.colorbar(im, cax=cax, orientation="vertical", label=plot_data.unit)

        ax.set_ylabel("DETY")
        ax.set_xlabel("DETX")

        # Histogram panel
        # Compute bin edges so that bins are centered at 1, 2, 3, ... (integers)
        min_center = 0
        max_center = int(np.ceil(np.nanmax(data)))
        bin_centers = np.arange(min_center, max_center + 1)
        bins = bin_centers - 0.5
        bins = np.append(bins, bins[-1] + 1)
        ax_hist.hist(data, bins=bins, color="gray", histtype="step", edgecolor="black", label="Counts")
        ax_hist.set_xlabel("Counts per detector")
        ax_hist.set_yscale("log")
        ax_hist.grid(True)
        mean_val = np.nanmean(data)
        ax_hist.axvline(mean_val, color="red", linestyle="--", label="Mean = {:.2f}".format(mean_val))
        ax_hist.legend()

        plt.tight_layout(rect=[0, 0, 1, 0.8])  # Make space for suptitle

        return fig, ax
time_bins=[-10,0]*u.s
energybins = [15, 350] * u.keV

event_dpi=event.create_dpi(timebins=time_bins, energybins=energybins, T0=t0, is_relative = True)

f = plot_dpi(event.dpis[-1], mask_value = [0, np.inf])
plt.show()
plt.savefig(os.path.join(workdir, 'dpi.png'), dpi=300, bbox_inches='tight')
<Figure size 640x480 with 0 Axes>
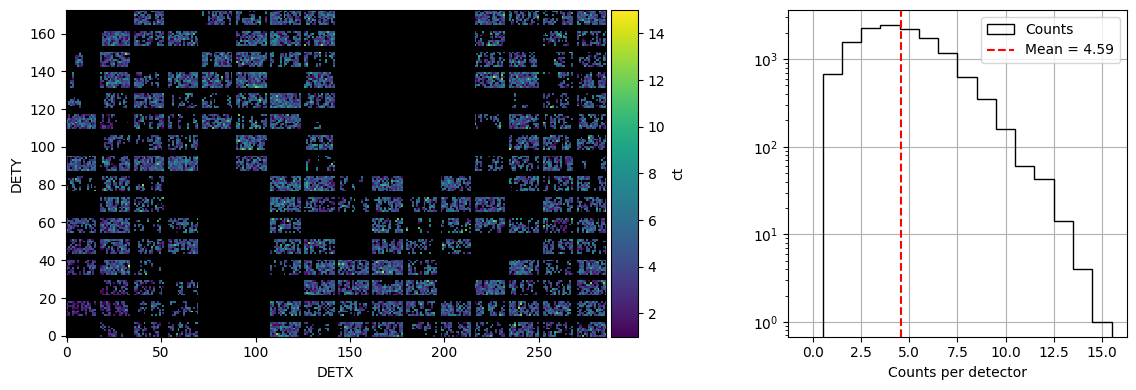
time_bins=[0,10]*u.s
logging.info(f'Plotting DPI plot for time bins {time_bins}')
energybins = [15, 350] * u.keV
event_dpi=event.create_dpi(timebins=time_bins, energybins=energybins, T0=t0, is_relative = True)
f = plot_dpi(event.dpis[-1], mask_value = [0, np.inf])
plt.show()
2025-12-18 12:39:24,453 - INFO - Plotting DPI plot for time bins [ 0. 10.] s
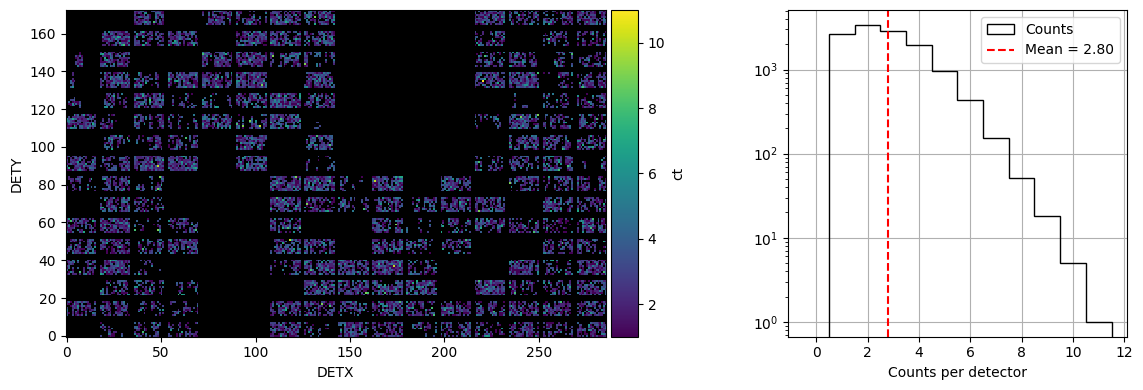
time_bins=[50,60]*u.s
logging.info(f'Plotting DPI plot for time bins {time_bins}')
energybins = [15, 350] * u.keV
event_dpi=event.create_dpi(timebins=time_bins, energybins=energybins, T0=t0, is_relative = True)
f = plot_dpi(event.dpis[-1], mask_value = [0, np.inf])
plt.show()
2025-12-18 12:39:24,813 - INFO - Plotting DPI plot for time bins [50. 60.] s
Light curve after applying mask weighting#
event.apply_mask_weighting(ra=ra_mos*u.deg, dec=dec_mos*u.deg)
Under the hood apply_mask_weighting does the following
input_dict = dict(
    infile=str(self.event_files),
    attitude=str(self.attitude_file),
    detmask=str(self.detector_quality_file),
    ra=ra.value,
    dec=dec.value,
    auxfile=str(temp_auxil_raytracing_file),
    clobber="YES",
)
batmaskwtevt_return = self._call_batmaskwtevt(input_dict)
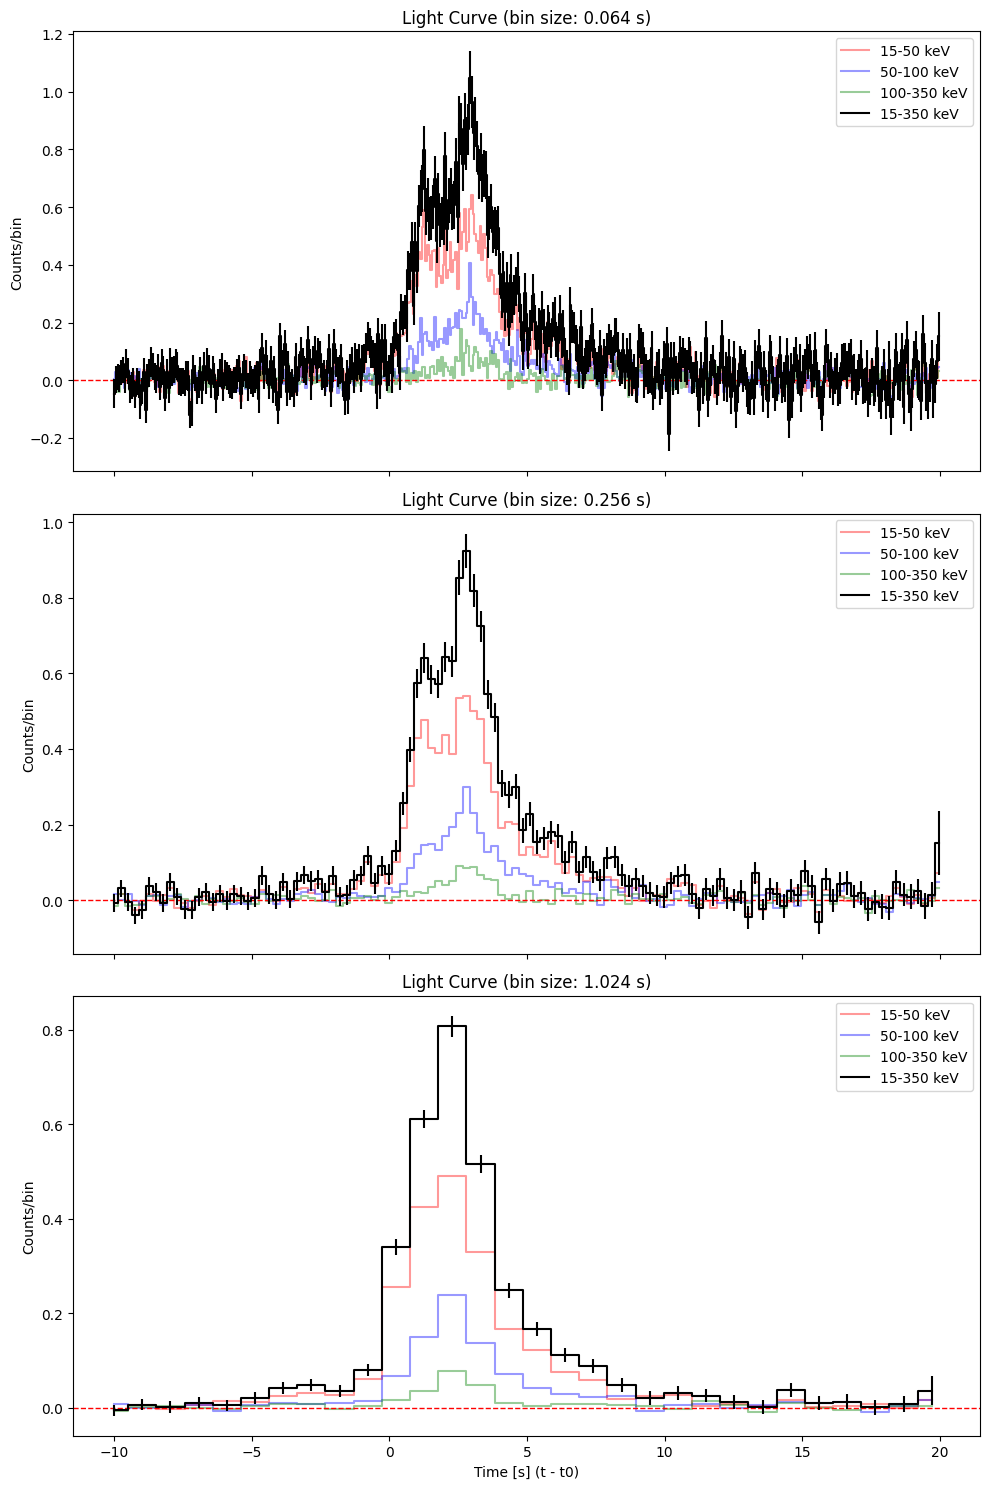
def plot_lc(event, t0, deltat, workdir, pipe):

    lc = event.create_lightcurve(energybins=[15, 50, 100, 350] * u.keV)

    color = ['red','blue', 'green', 'black']
    label = ['15-50 keV', '50-100 keV', '100-350 keV', '15-350 keV']
    bin_sizes = [0.064, 0.256, 1.024]  # in seconds

    fig, axes = plt.subplots(len(bin_sizes), 1, figsize=(10, 5 * len(bin_sizes)), sharex=True)

    for i, bin_size in enumerate(bin_sizes):
        ax = axes[i]
        lc.set_timebins(
                    timebinalg="uniform",
                    timedelta=np.timedelta64(int(bin_size*1000), 'ms'),
                    tmin=-5*deltat*u.s,
                    tmax=10*deltat*u.s,
                    T0=t0,
                    is_relative = True)
        lc.set_energybins(energybins=[15, 50, 100, 350]* u.keV)
        # Now plot each sub-band
        for n in range(0,4):
            time = lc.data['TIME'][:].value
            counts = lc.data['RATE'][:,n].value
            errors = lc.data['ERROR'][:,n].value
            if n==3:
                ax.errorbar(time-t0, counts, yerr=errors, color=color[n], ls='', zorder=n, alpha=1.0)
                ax.step(time-t0, counts, where='mid', color=color[n], label=label[n], zorder=n, alpha=1.0)
            else:
                ax.step(time-t0, counts, where='mid', color=color[n], label=label[n], zorder=n, alpha=0.4)
        ax.set_title(f"Light Curve (bin size: {bin_size:.3f} s)")
        ax.axhline(y=0.0, color='r', linestyle='--', linewidth=1)
        ax.set_ylabel("Counts/bin")
        ax.legend()


    axes[-1].set_xlabel("Time [s] (t - t0)")
    plt.tight_layout()
    plt.show()
    plt.savefig(os.path.join(workdir, f'lc_{pipe}.png'), dpi=300)
    plt.close()
delta_t = 2  # typical duration in seconds of the event
plot_lc(event, t0, delta_t, workdir, 'mosaic')
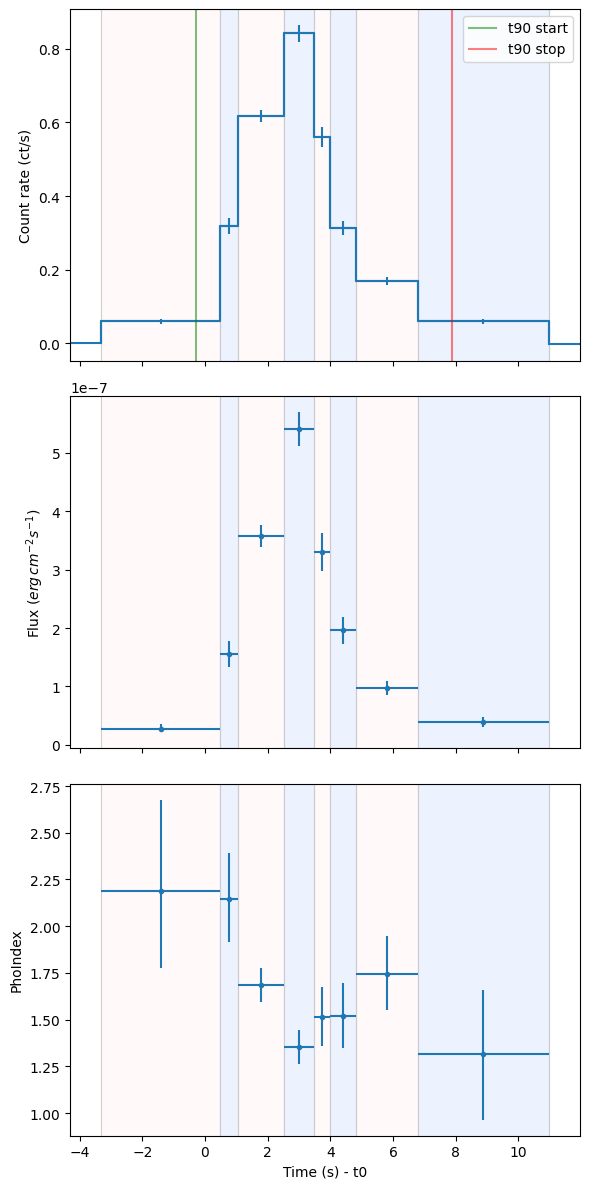
Bayesian blocks light curve#
lc=event.create_lightcurve(energybins=[15, 350] * u.keV)
lc.set_timebins(timebinalg="bayesian", save_durations=True)

bayesian_tstart = lc.tbins["TIME_START"]
bayesian_tstop = lc.tbins["TIME_STOP"]
t90_start = lc.tdurs['T90']['TSTART']
t90_stop = lc.tdurs['T90']['TSTOP']
mask = (bayesian_tstop >= t90_start) & (bayesian_tstart <= t90_stop)

lc.plot(T0=t0, plot_relative=True)

# Highlight T90 interval
plt.axvspan(t90_start.value - t0, t90_stop.value - t0, color='gray', alpha=0.3, label='T90 Interval')
plt.legend()
plt.xlim(-5, 15)
plt.title("Bayesian Block Light Curve")
Text(0.5, 1.0, 'Bayesian Block Light Curve')
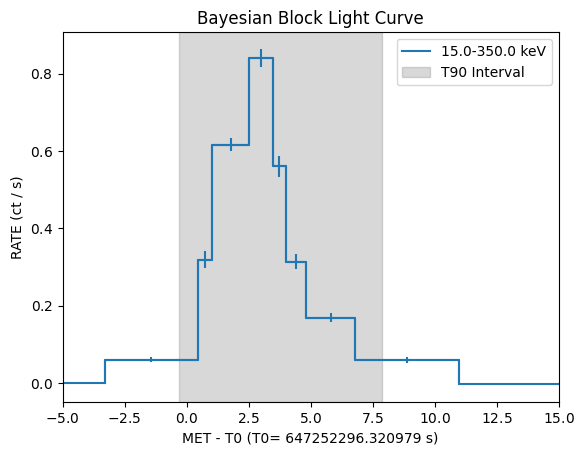
print(f"The t_90 duration is {lc.tdurs['T90']['TSTOP'] - lc.tdurs['T90']['TSTART']:.2f}")
print(f"Emission start time: {lc.tdurs['T90']['TSTART'].value - t0:.2f} seconds relative to t0")
print(f"Emission stop time: {lc.tdurs['T90']['TSTOP'].value - t0:.2f} seconds relative to t0")
The t_90 duration is 8.19 s
Emission start time: -0.30 seconds relative to t0
Emission stop time: 7.90 seconds relative to t0
Spectrum during the \(t_{90}\) interval (approximate method)#
spectrum_t90_fake=event.create_pha(tstart=lc.tdurs['T90']['TSTART'],
                                    tstop=lc.tdurs['T90']['TSTOP'], recalc=True)
ba.fit_spectrum(spectrum_t90_fake, generic_model="cflux*po",
                setPars={1:"15,-1", 2:"150,-1",3:-9, 4:"-1",5:".001,-1"},
                use_cstat=False, fit_iterations=10000)
1 spectrum  in use

Spectral Data File: t_647252296.024-647252304.2159998_80chan.pha  Spectrum 1
Net count rate (cts/s) for Spectrum:1  3.673e-01 +/- 8.905e-03
 Assigned to Data Group 1 and Plot Group 1
  Noticed Channels:  1-80
  Telescope: SWIFT Instrument: BAT  Channel Type: PI
  Exposure Time: 8.192 sec
 Using fit statistic: chi
 Using Response (RMF) File            t_647252296.024-647252304.2159998_80chan.rsp for Source 1


Fit statistic  : Chi-Squared                   64.01     using 80 bins.

***Warning: Chi-square may not be valid due to bins with zero variance
            in spectrum number: 1

Test statistic : Chi-Squared                   64.01     using 80 bins.

***Warning: Chi-square may not be valid due to bins with zero variance
            in spectrum number(s): 1

 Null hypothesis probability of 8.73e-01 with 78 degrees of freedom
 Current data and model not fit yet.

========================================================================
Model cflux<1>*powerlaw<2> Source No.: 1   Active/On
Model Model Component  Parameter  Unit     Value
 par  comp
   1    1   cflux      Emin       keV      15.0000      frozen
   2    1   cflux      Emax       keV      150.000      frozen
   3    1   cflux      lg10Flux   cgs      -9.00000     +/-  0.0
   4    2   powerlaw   PhoIndex            -1.00000     +/-  0.0
   5    2   powerlaw   norm                1.00000E-03  frozen
________________________________________________________________________


Fit statistic  : Chi-Squared                 2704.34     using 80 bins.

***Warning: Chi-square may not be valid due to bins with zero variance
            in spectrum number: 1

Test statistic : Chi-Squared                 2704.34     using 80 bins.

***Warning: Chi-square may not be valid due to bins with zero variance
            in spectrum number(s): 1

 Null hypothesis probability of 0.00e+00 with 78 degrees of freedom
 Current data and model not fit yet.
Default fit statistic is set to: Chi-Squared
   This will apply to all current and newly loaded spectra.

Fit statistic  : Chi-Squared                 2704.34     using 80 bins.

***Warning: Chi-square may not be valid due to bins with zero variance
            in spectrum number: 1

Test statistic : Chi-Squared                 2704.34     using 80 bins.

***Warning: Chi-square may not be valid due to bins with zero variance
            in spectrum number(s): 1

 Null hypothesis probability of 0.00e+00 with 78 degrees of freedom
 Current data and model not fit yet.
     4 channels (1-4) ignored in spectrum #     1
    18 channels (63-80) ignored in spectrum #     1

Fit statistic  : Chi-Squared                 2650.95     using 58 bins.

Test statistic : Chi-Squared                 2650.95     using 58 bins.
 Null hypothesis probability of 0.00e+00 with 56 degrees of freedom
 Current data and model not fit yet.

 Warning: renorm - no variable model to allow  renormalization

Fit statistic  : Chi-Squared                 2650.95     using 58 bins.

Test statistic : Chi-Squared                 2650.95     using 58 bins.
 Null hypothesis probability of 0.00e+00 with 56 degrees of freedom
 Current data and model not fit yet.
 Warning: renorm - no variable model to allow  renormalization
                                   Parameters
Chi-Squared  |beta|/N    Lvl    3:lg10Flux    4:PhoIndex
2610.76      7.83296       1      -8.45406     -0.189714
2554.71      30.9643       1      -8.24714      0.765039
2485.08      63.2005       1      -8.08395       1.22997
1162.04      102.565       0      -7.05387       3.27156
567.068      369.118       0      -6.93903       2.06823
87.2307      685.765      -1      -6.62206       1.42033
50.2465      228.397      -2      -6.66329       1.59552
50.1066      5.62341      -3      -6.66501       1.60972
50.1066      0.0291837    -4      -6.66501       1.60966
==============================
 Variances and Principal Axes
                 3        4
 7.0989E-05|  0.9957   0.0930
 1.4874E-03| -0.0930   0.9957
------------------------------

========================
  Covariance Matrix
        1           2
   8.324e-05  -1.312e-04
  -1.312e-04   1.475e-03
------------------------

========================================================================
Model cflux<1>*powerlaw<2> Source No.: 1   Active/On
Model Model Component  Parameter  Unit     Value
 par  comp
   1    1   cflux      Emin       keV      15.0000      frozen
   2    1   cflux      Emax       keV      150.000      frozen
   3    1   cflux      lg10Flux   cgs      -6.66501     +/-  9.12364E-03
   4    2   powerlaw   PhoIndex            1.60966      +/-  3.84081E-02
   5    2   powerlaw   norm                1.00000E-03  frozen
________________________________________________________________________


Fit statistic  : Chi-Squared                   50.11     using 58 bins.

Test statistic : Chi-Squared                   50.11     using 58 bins.
 Null hypothesis probability of 6.96e-01 with 56 degrees of freedom

Parameters defined:
========================================================================
Model cflux<1>*powerlaw<2> Source No.: 1   Active/On
Model Model Component  Parameter  Unit     Value
 par  comp
   1    1   cflux      Emin       keV      15.0000      frozen
   2    1   cflux      Emax       keV      150.000      frozen
   3    1   cflux      lg10Flux   cgs      -6.66501     +/-  9.12364E-03
   4    2   powerlaw   PhoIndex            1.60966      +/-  3.84081E-02
   5    2   powerlaw   norm                1.00000E-03  frozen
________________________________________________________________________


Fit statistic  : Chi-Squared                   50.11     using 58 bins.

Test statistic : Chi-Squared                   50.11     using 58 bins.
 Null hypothesis probability of 6.96e-01 with 56 degrees of freedom
*** Parameter 1 is not a variable model parameter and no confidence range will be calculated.
 Parameter   Confidence Range (2.706)
*** Parameter 2 is not a variable model parameter and no confidence range will be calculated.
 Parameter   Confidence Range (2.706)
 Parameter   Confidence Range (2.706)
     3     -6.68031     -6.65018    (-0.0153035,0.0148229)
 Parameter   Confidence Range (2.706)
     4      1.54684      1.67283    (-0.0628242,0.0631651)
*** Parameter 5 is not a variable model parameter and no confidence range will be calculated.
 Parameter   Confidence Range (2.706)

params = spectrum_t90_fake.spectral_model['parameters']
lg10_flux = params['lg10Flux']
flux = 10 ** lg10_flux['val']
flux_lo = 10 ** lg10_flux['lolim']
flux_hi = 10 ** lg10_flux['hilim']

print(f"Converted flux: best fit = {flux:.3e}, interval = ({flux_lo:.3e}, {flux_hi:.3e})")
# photon index
photon_index = params['PhoIndex']['val']
photon_index_lo = params['PhoIndex']['lolim']
photon_index_hi = params['PhoIndex']['hilim']

print(f"Photon index: best fit = {photon_index:.3f}, interval = ({photon_index_lo:.3f}, {photon_index_hi:.3f})")
Converted flux: best fit = 2.163e-07, interval = (2.088e-07, 2.238e-07)
Photon index: best fit = 1.610, interval = (1.547, 1.673)
Spectrum during \(t_{90}\) (correct way)#
We first create a spectrum for each bayesian block and then we fit them
bayesian_spectra = event.create_pha(
    tstart=bayesian_tstart[mask],
    tstop=bayesian_tstop[mask],
    recalc=True
)
import os
from joblib import parallel_backend

joblib_tmp = os.path.join(workdir, "joblib_tmp")
os.makedirs(joblib_tmp, exist_ok=True)
os.environ["JOBLIB_TEMP_FOLDER"] = joblib_tmp

n_procs = min(len(bayesian_spectra), multiprocessing.cpu_count())

with parallel_backend(
    'loky',
    n_jobs=n_procs,
    max_nbytes=None,
    inner_max_num_threads=1,
    temp_folder=joblib_tmp
):
    output_bayesian_spectra = ba.parallel.batspectrum_TTE_analysis(
        bayesian_spectra,
        generic_model="cflux*po",
        setPars={1:"15,-1", 2:"150,-1", 3:-9, 4:"-1", 5:".001,-1"},
        nprocs=n_procs,
        use_cstat=False,
        fit_iterations=10000,
        recalc=True
    )
1 spectrum in use
Spectral Data File: t_647252301.144-647252303.128_80chan.pha Spectrum 1
Net count rate (cts/s) for Spectrum:1 1.699e-01 +/- 1.262e-02
Assigned to Data Group 1 and Plot Group 1
Noticed Channels: 1-80
Telescope: SWIFT Instrument: BAT Channel Type: PI
Exposure Time: 1.984 sec
Using fit statistic: chi
Using Response (RMF) File t_647252301.144-647252303.128_80chan.rsp for Source 1
1 spectrum in use
Spectral Data File: t_647252303.128-647252307.2879999_80chan.pha Spectrum 1
Net count rate (cts/s) for Spectrum:1 6.266e-02 +/- 7.803e-03
Assigned to Data Group 1 and Plot Group 1
Noticed Channels: 1-80
Telescope: SWIFT Instrument: BAT Channel Type: PI
Exposure Time: 4.16 sec
Using fit statistic: chi
Using Response (RMF) File t_647252303.128-647252307.2879999_80chan.rsp for Source 1
========================================================================
Model cflux<1>*powerlaw<2> Source No.: 1 Active/On
Model Model Component Parameter Unit Value
par comp
1 1 cflux Emin keV 15.0000 frozen
2 1 cflux Emax keV 150.000 frozen
3 1 cflux lg10Flux cgs -9.00000 +/- 0.0
4 2 powerlaw PhoIndex -1.00000 +/- 0.0
5 2 powerlaw norm 1.00000E-03 frozen
________________________________________________________________________
Fit statistic : Chi-Squared 330.93 using 80 bins.
***Warning: Chi-square may not be valid due to bins with zero variance
in spectrum number: 1
Test statistic : Chi-Squared 330.93 using 80 bins.
***Warning: Chi-square may not be valid due to bins with zero variance
in spectrum number(s): 1
Null hypothesis probability of 6.99e-33 with 78 degrees of freedom
Current data and model not fit yet.
========================================================================
Model cflux<1>*powerlaw<2> Source No.: 1 Active/On
Model Model Component Parameter Unit Value
par comp
1 1 cflux Emin keV 15.0000 frozen
2 1 cflux Emax keV 150.000 frozen
3 1 cflux lg10Flux cgs -9.00000 +/- 0.0
4 2 powerlaw PhoIndex -1.00000 +/- 0.0
5 2 powerlaw norm 1.00000E-03 frozen
________________________________________________________________________
Fit statistic : Chi-Squared 158.95 using 80 bins.
***Warning: Chi-square may not be valid due to bins with zero variance
in spectrum number: 1
Test statistic : Chi-Squared 158.95 using 80 bins.
***Warning: Chi-square may not be valid due to bins with zero variance
in spectrum number(s): 1
Default fit statistic is set to: Chi-Squared
This will apply to all current and newly loaded spectra.
Null hypothesis probability of 1.77e-07 with 78 degrees of freedom
Current data and model not fit yet.
Fit statistic : Chi-Squared 330.93 using 80 bins.
***Warning: Chi-square may not be valid due to bins with zero variance
in spectrum number: 1
Test statistic : Chi-Squared 330.93 using 80 bins.
***Warning: Chi-square may not be valid due to bins with zero variance
in spectrum number(s): 1
Null hypothesis probability of 6.99e-33 with 78 degrees of freedom
Current data and model not fit yet.
Default fit statistic is set to: Chi-Squared
This will apply to all current and newly loaded spectra.
Fit statistic : Chi-Squared 158.95 using 80 bins.
***Warning: Chi-square may not be valid due to bins with zero variance
in spectrum number: 1
Test statistic : Chi-Squared 158.95 using 80 bins.
***Warning: Chi-square may not be valid due to bins with zero variance
in spectrum number(s): 1
Null hypothesis probability of 1.77e-07 with 78 degrees of freedom
Current data and model not fit yet.
1 spectrum in use
Spectral Data File: t_647252299.8-647252300.312_80chan.pha Spectrum 1
Net count rate (cts/s) for Spectrum:1 5.702e-01 +/- 2.989e-02
Assigned to Data Group 1 and Plot Group 1
Noticed Channels: 1-80
Telescope: SWIFT Instrument: BAT Channel Type: PI
Exposure Time: 0.512 sec
Using fit statistic: chi
Using Response (RMF) File t_647252299.8-647252300.312_80chan.rsp for Source 1
========================================================================
Model cflux<1>*powerlaw<2> Source No.: 1 Active/On
Model Model Component Parameter Unit Value
par comp
1 1 cflux Emin keV 15.0000 frozen
2 1 cflux Emax keV 150.000 frozen
3 1 cflux lg10Flux cgs -9.00000 +/- 0.0
4 2 powerlaw PhoIndex -1.00000 +/- 0.0
5 2 powerlaw norm 1.00000E-03 frozen
________________________________________________________________________
1 spectrum in use
Spectral Data File: t_647252300.312-647252301.144_80chan.pha Spectrum 1
Net count rate (cts/s) for Spectrum:1 3.255e-01 +/- 2.042e-02
Assigned to Data Group 1 and Plot Group 1
Noticed Channels: 1-80
Telescope: SWIFT Instrument: BAT Channel Type: PI
Exposure Time: 0.832 sec
Using fit statistic: chi
Using Response (RMF) File t_647252300.312-647252301.144_80chan.rsp for Source 1
Fit statistic : Chi-Squared 461.63 using 80 bins.
***Warning: Chi-square may not be valid due to bins with zero variance
in spectrum number: 1
Test statistic : Chi-Squared 461.63 using 80 bins.
***Warning: Chi-square may not be valid due to bins with zero variance
in spectrum number(s): 1
Null hypothesis probability of 8.34e-56 with 78 degrees of freedom
Current data and model not fit yet.
Default fit statistic is set to: Chi-Squared
This will apply to all current and newly loaded spectra.
========================================================================
Model cflux<1>*powerlaw<2> Source No.: 1 Active/On
Model Model Component Parameter Unit Value
par comp
1 1 cflux Emin keV 15.0000 frozen
2 1 cflux Emax keV 150.000 frozen
Fit statistic : Chi-Squared 461.63 using 80 bins.
***Warning: Chi-square may not be valid due to bins with zero variance
in spectrum number: 1
3 1 cflux lg10Flux cgs -9.00000 +/- 0.0
4 2 powerlaw PhoIndex -1.00000 +/- 0.0
Test statistic : Chi-Squared 461.63 using 80 bins.
***Warning: Chi-square may not be valid due to bins with zero variance
in spectrum number(s): 1
Null hypothesis probability of 8.34e-56 with 78 degrees of freedom
Current data and model not fit yet.
5 2 powerlaw norm 1.00000E-03 frozen
________________________________________________________________________
Fit statistic : Chi-Squared 365.39 using 80 bins.
***Warning: Chi-square may not be valid due to bins with zero variance
in spectrum number: 1
Test statistic : Chi-Squared 365.39 using 80 bins.
***Warning: Chi-square may not be valid due to bins with zero variance
in spectrum number(s): 1
Null hypothesis probability of 9.66e-39 with 78 degrees of freedom
Current data and model not fit yet.
Default fit statistic is set to: Chi-Squared
This will apply to all current and newly loaded spectra.
1 spectrum in use
Spectral Data File: t_647252296.792-647252297.368_80chan.pha Spectrum 1
Net count rate (cts/s) for Spectrum:1 3.310e-01 +/- 2.444e-02
Assigned to Data Group 1 and Plot Group 1
Noticed Channels: 1-80
Telescope: SWIFT Instrument: BAT Channel Type: PI
Exposure Time: 0.576 sec
Using fit statistic: chi
Using Response (RMF) File t_647252296.792-647252297.368_80chan.rsp for Source 1
Fit statistic : Chi-Squared 365.39 using 80 bins.
***Warning: Chi-square may not be valid due to bins with zero variance
in spectrum number: 1
Test statistic : Chi-Squared 365.39 using 80 bins.
***Warning: Chi-square may not be valid due to bins with zero variance
in spectrum number(s): 1
Null hypothesis probability of 9.66e-39 with 78 degrees of freedom
Current data and model not fit yet.
========================================================================
Model cflux<1>*powerlaw<2> Source No.: 1 Active/On
Model Model Component Parameter Unit Value
par comp
1 1 cflux Emin keV 15.0000 frozen
2 1 cflux Emax keV 150.000 frozen
3 1 cflux lg10Flux cgs -9.00000 +/- 0.0
4 2 powerlaw PhoIndex -1.00000 +/- 0.0
5 2 powerlaw norm 1.00000E-03 frozen
________________________________________________________________________
Fit statistic : Chi-Squared 283.13 using 80 bins.
***Warning: Chi-square may not be valid due to bins with zero variance
in spectrum number: 1
Test statistic : Chi-Squared 283.13 using 80 bins.
***Warning: Chi-square may not be valid due to bins with zero variance
in spectrum number(s): 1
Null hypothesis probability of 4.69e-25 with 78 degrees of freedom
Current data and model not fit yet.
Default fit statistic is set to: Chi-Squared
This will apply to all current and newly loaded spectra.
4 channels (1-4) ignored in spectrum # 1
Fit statistic : Chi-Squared 283.13 using 80 bins.
***Warning: Chi-square may not be valid due to bins with zero variance
in spectrum number: 1
Test statistic : Chi-Squared 283.13 using 80 bins.
***Warning: Chi-square may not be valid due to bins with zero variance
in spectrum number(s): 1
Null hypothesis probability of 4.69e-25 with 78 degrees of freedom
Current data and model not fit yet.
4 channels (1-4) ignored in spectrum # 1
18 channels (63-80) ignored in spectrum # 1
Fit statistic : Chi-Squared 134.77 using 58 bins.
Test statistic : Chi-Squared 134.77 using 58 bins.
Null hypothesis probability of 1.93e-08 with 56 degrees of freedom
Current data and model not fit yet.
Warning: renorm - no variable model to allow renormalization
Parameters
Chi-Squared |beta|/N Lvl 3:lg10Flux 4:PhoIndex
Fit statistic : Chi-Squared 314.33 using 58 bins.
Test statistic : Chi-Squared 314.33 using 58 bins.
Null hypothesis probability of 1.23e-37 with 56 degrees of freedom
Current data and model not fit yet.
Warning: renorm - no variable model to allow renormalization
4 channels (1-4) ignored in spectrum # 1
Fit statistic : Chi-Squared 314.33 using 58 bins.
Test statistic : Chi-Squared 314.33 using 58 bins.
Null hypothesis probability of 1.23e-37 with 56 degrees of freedom
Current data and model not fit yet.
Warning: renorm - no variable model to allow renormalization
Parameters
Chi-Squared |beta|/N Lvl 3:lg10Flux 4:PhoIndex
105.221 1.27464 0 -8.00804 1.25280
77.2753 15.9241 0 -7.37262 1.87890
4 channels (1-4) ignored in spectrum # 1
63.5035 36.6712 -1 -7.41347 1.45993
1 spectrum in use
Spectral Data File: t_647252298.8399999-647252299.8_80chan.pha Spectrum 1
Net count rate (cts/s) for Spectrum:1 8.629e-01 +/- 2.716e-02
Assigned to Data Group 1 and Plot Group 1
Noticed Channels: 1-80
Telescope: SWIFT Instrument: BAT Channel Type: PI
Exposure Time: 0.96 sec
Using fit statistic: chi
Using Response (RMF) File t_647252298.8399999-647252299.8_80chan.rsp for Source 1
62.9907 2.3695 -2 -7.40334 1.31265
312.195 1.01729 1 -8.78374 -0.00229211
18 channels (63-80) ignored in spectrum # 1
========================================================================
Model cflux<1>*powerlaw<2> Source No.: 1 Active/On
Model Model Component Parameter Unit Value
par comp
1 1 cflux Emin keV 15.0000 frozen
62.9905 0.0882045 -3 -7.40310 1.31450
2 1 cflux Emax keV 150.000 frozen
3 1 cflux lg10Flux cgs -9.00000 +/- 0.0
4 2 powerlaw PhoIndex -1.00000 +/- 0.0
5 2 powerlaw norm 1.00000E-03 frozen
________________________________________________________________________
Fit statistic : Chi-Squared 421.46 using 58 bins.
Test statistic : Chi-Squared 421.46 using 58 bins.
Null hypothesis probability of 1.75e-57 with 56 degrees of freedom
Current data and model not fit yet.
==============================
Variances and Principal Axes
3 4
2.5008E-03| 0.9942 0.1076
4.5432E-02| -0.1076 0.9942
------------------------------
========================
Covariance Matrix
1 2
2.998e-03 -4.593e-03
Warning: renorm - no variable model to allow renormalization
-4.593e-03 4.493e-02
------------------------
========================================================================
Model cflux<1>*powerlaw<2> Source No.: 1 Active/On
Model Model Component Parameter Unit Value
par comp
1 1 cflux Emin keV 15.0000 frozen
2 1 cflux Emax keV 150.000 frozen
3 1 cflux lg10Flux cgs -7.40310 +/- 5.47528E-02
4 2 powerlaw PhoIndex 1.31450 +/- 0.211978
5 2 powerlaw norm 1.00000E-03 frozen
________________________________________________________________________
Fit statistic : Chi-Squared 62.99 using 58 bins.
Test statistic : Chi-Squared 62.99 using 58 bins.
Null hypothesis probability of 2.43e-01 with 56 degrees of freedom
305.359 2.26733 1 -8.57628 1.34373
Fit statistic : Chi-Squared 421.46 using 58 bins.
Test statistic : Chi-Squared 421.46 using 58 bins.
Fit statistic : Chi-Squared 1292.75 using 80 bins.
Null hypothesis probability of 1.75e-57 with 56 degrees of freedom
Current data and model not fit yet.
***Warning: Chi-square may not be valid due to bins with zero variance
in spectrum number: 1
Test statistic : Chi-Squared 1292.75 using 80 bins.
***Warning: Chi-square may not be valid due to bins with zero variance
in spectrum number(s): 1
Null hypothesis probability of 2.45e-219 with 78 degrees of freedom
Current data and model not fit yet.
Warning: renorm - no variable model to allow renormalization
Parameters
Chi-Squared |beta|/N Lvl 3:lg10Flux 4:PhoIndex
18 channels (63-80) ignored in spectrum # 1
Default fit statistic is set to: Chi-Squared
This will apply to all current and newly loaded spectra.
297.937 6.22769 1 -8.40895 1.75537
4 channels (1-4) ignored in spectrum # 1
Fit statistic : Chi-Squared 337.40 using 58 bins.
Test statistic : Chi-Squared 337.40 using 58 bins.
Null hypothesis probability of 8.04e-42 with 56 degrees of freedom
Current data and model not fit yet.
Fit statistic : Chi-Squared 1292.75 using 80 bins.
***Warning: Chi-square may not be valid due to bins with zero variance
in spectrum number: 1
Test statistic : Chi-Squared 1292.75 using 80 bins.
***Warning: Chi-square may not be valid due to bins with zero variance
in spectrum number(s): 1
Null hypothesis probability of 2.45e-219 with 78 degrees of freedom
Warning: renorm - no variable model to allow renormalization
Current data and model not fit yet.
185.33 10.407 0 -7.49397 3.44691
Fit statistic : Chi-Squared 337.40 using 58 bins.
Test statistic : Chi-Squared 337.40 using 58 bins.
Null hypothesis probability of 8.04e-42 with 56 degrees of freedom
Current data and model not fit yet.
Warning: renorm - no variable model to allow renormalization
Parameters
Chi-Squared |beta|/N Lvl 3:lg10Flux 4:PhoIndex
143.521 32.1482 0 -7.36402 2.43953
412.531 0.723392 1 -8.08474 -0.854001
97.7934 56.5072 -1 -6.95217 1.34073
237.158 5.78743 0 -7.02611 1.59540
85.5339 18.2129 -2 -7.01537 1.75848
77.5202 89.6002 0 -6.53291 2.01818
333.71 0.745175 1 -8.52131 0.0895187
18 channels (63-80) ignored in spectrum # 1
85.5162 1.20645 -3 -7.01124 1.74314
51.7457 51.0099 -1 -6.50562 1.60814
Fit statistic : Chi-Squared 250.63 using 58 bins.
Test statistic : Chi-Squared 250.63 using 58 bins.
Null hypothesis probability of 1.95e-26 with 56 degrees of freedom
Current data and model not fit yet.
325.303 2.88821 1 -8.27249 1.27901
Warning: renorm - no variable model to allow renormalization
Fit statistic : Chi-Squared 250.63 using 58 bins.
Test statistic : Chi-Squared 250.63 using 58 bins.
Null hypothesis probability of 1.95e-26 with 56 degrees of freedom
Current data and model not fit yet.
50.5973 11.2414 -2 -6.48171 1.51813
Warning: renorm - no variable model to allow renormalization
Parameters
Chi-Squared |beta|/N Lvl 3:lg10Flux 4:PhoIndex
1 spectrum in use
Spectral Data File: t_647252297.368-647252298.8400002_80chan.pha Spectrum 1
Net count rate (cts/s) for Spectrum:1 6.285e-01 +/- 2.028e-02
Assigned to Data Group 1 and Plot Group 1
Noticed Channels: 1-80
Telescope: SWIFT Instrument: BAT Channel Type: PI
Exposure Time: 1.472 sec
Using fit statistic: chi
Using Response (RMF) File t_647252297.368-647252298.8400002_80chan.rsp for Source 1
317.006 7.74082 1 -8.11000 1.62275
50.5964 0.359361 -3 -6.48104 1.51575
==============================
Variances and Principal Axes
3 4
4.9467E-04| 0.9902 0.1394
9.1602E-03| -0.1394 0.9902
------------------------------
========================
Covariance Matrix
1 2
6.631e-04 -1.196e-03
-1.196e-03 8.992e-03
------------------------
========================================================================
Model cflux<1>*powerlaw<2> Source No.: 1 Active/On
Model Model Component Parameter Unit Value
par comp
1 1 cflux Emin keV 15.0000 frozen
2 1 cflux Emax keV 150.000 frozen
3 1 cflux lg10Flux cgs -6.48104 +/- 2.57510E-02
4 2 powerlaw PhoIndex 1.51575 +/- 9.48250E-02
5 2 powerlaw norm 1.00000E-03 frozen
________________________________________________________________________
Fit statistic : Chi-Squared 50.60 using 58 bins.
Test statistic : Chi-Squared 50.60 using 58 bins.
Null hypothesis probability of 6.79e-01 with 56 degrees of freedom
188.843 12.4064 0 -7.21377 3.08459
*** Parameter 1 is not a variable model parameter and no confidence range will be calculated.
Parameter Confidence Range (2.706)
*** Parameter 2 is not a variable model parameter and no confidence range will be calculated.
========================================================================
Model cflux<1>*powerlaw<2> Source No.: 1 Active/On
Model Model Component Parameter Unit Value
par comp
1 1 cflux Emin keV 15.0000 frozen
Parameter Confidence Range (2.706)
2 1 cflux Emax keV 150.000 frozen
3 1 cflux lg10Flux cgs -9.00000 +/- 0.0
140.998 38.7527 0 -7.07488 2.26793
4 2 powerlaw PhoIndex -1.00000 +/- 0.0
5 2 powerlaw norm 1.00000E-03 frozen
Parameter Confidence Range (2.706)
________________________________________________________________________
249.223 0.413751 1 -8.72805 0.299514
85.516 0.055634 -4 -7.01145 1.74476
Fit statistic : Chi-Squared 1281.63 using 80 bins.
84.5696 63.2535 -1 -6.64797 1.10291
***Warning: Chi-square may not be valid due to bins with zero variance
in spectrum number: 1
Test statistic : Chi-Squared 1281.63 using 80 bins.
***Warning: Chi-square may not be valid due to bins with zero variance
in spectrum number(s): 1
Null hypothesis probability of 4.58e-217 with 78 degrees of freedom
Current data and model not fit yet.
==============================
Variances and Principal Axes
242.101 1.24697 1 -8.43915 2.16252
3 4
7.9371E-04| 0.9887 0.1498
1.6029E-02| -0.1498 0.9887
68.2837 23.8849 -2 -6.71009 1.53744
------------------------------
========================
Covariance Matrix
1 2
1.136e-03 -2.256e-03
-2.256e-03 1.569e-02
------------------------
========================================================================
Model cflux<1>*powerlaw<2> Source No.: 1 Active/On
Default fit statistic is set to: Chi-Squared
This will apply to all current and newly loaded spectra.
Model Model Component Parameter Unit Value
par comp
Fit statistic : Chi-Squared 1281.63 using 80 bins.
***Warning: Chi-square may not be valid due to bins with zero variance
in spectrum number: 1
236.02 5.34116 1 -8.26263 2.55796
Test statistic : Chi-Squared 1281.63 using 80 bins.
***Warning: Chi-square may not be valid due to bins with zero variance
in spectrum number(s): 1
Null hypothesis probability of 4.58e-217 with 78 degrees of freedom
Current data and model not fit yet.
68.2568 0.77587 -3 -6.70728 1.51833
1 1 cflux Emin keV 15.0000 frozen
2 1 cflux Emax keV 150.000 frozen
3 1 cflux lg10Flux cgs -7.01145 +/- 3.36979E-02
4 2 powerlaw PhoIndex 1.74476 +/- 0.125250
5 2 powerlaw norm 1.00000E-03 frozen
________________________________________________________________________
Fit statistic : Chi-Squared 85.52 using 58 bins.
Test statistic : Chi-Squared 85.52 using 58 bins.
Null hypothesis probability of 6.74e-03 with 56 degrees of freedom
147.936 8.73427 0 -7.36082 4.23009
68.2566 0.0798286 -4 -6.70753 1.52021
==============================
Variances and Principal Axes
3 4
6.7728E-04| 0.9887 0.1499
1.2472E-02| -0.1499 0.9887
------------------------------
========================
Covariance Matrix
1 2
9.423e-04 -1.748e-03
-1.748e-03 1.221e-02
------------------------
========================================================================
Model cflux<1>*powerlaw<2> Source No.: 1 Active/On
Model Model Component Parameter Unit Value
par comp
1 1 cflux Emin keV 15.0000 frozen
2 1 cflux Emax keV 150.000 frozen
3 1 cflux lg10Flux cgs -6.70753 +/- 3.06977E-02
4 2 powerlaw PhoIndex 1.52021 +/- 0.110487
5 2 powerlaw norm 1.00000E-03 frozen
________________________________________________________________________
Fit statistic : Chi-Squared 68.26 using 58 bins.
Test statistic : Chi-Squared 68.26 using 58 bins.
Null hypothesis probability of 1.26e-01 with 56 degrees of freedom
104.176 35.0969 0 -7.15710 2.52877
60.7358 55.7465 -1 -6.71430 1.93911
52.8374 45.9141 -2 -6.80029 2.11560
52.7774 2.52985 -3 -6.80891 2.14478
*** Parameter 1 is not a variable model parameter and no confidence range will be calculated.
Parameter Confidence Range (2.706)
52.7773 0.0429071 -4 -6.80872 2.14317
==============================
Variances and Principal Axes
3 4
9.2376E-04| 0.9899 0.1418
2.2964E-02| -0.1418 0.9899
*** Parameter 2 is not a variable model parameter and no confidence range will be calculated.
------------------------------
========================
Covariance Matrix
1 2
1.367e-03 -3.094e-03
-3.094e-03 2.252e-02
------------------------
Parameter Confidence Range (2.706)
========================================================================
Model cflux<1>*powerlaw<2> Source No.: 1 Active/On
Model Model Component Parameter Unit Value
par comp
1 1 cflux Emin keV 15.0000 frozen
2 1 cflux Emax keV 150.000 frozen
3 1 cflux lg10Flux cgs -6.80872 +/- 3.69746E-02
4 2 powerlaw PhoIndex 2.14317 +/- 0.150067
5 2 powerlaw norm 1.00000E-03 frozen
________________________________________________________________________
Fit statistic : Chi-Squared 52.78 using 58 bins.
Test statistic : Chi-Squared 52.78 using 58 bins.
Null hypothesis probability of 5.98e-01 with 56 degrees of freedom
Parameter Confidence Range (2.706)
4 channels (1-4) ignored in spectrum # 1
*** Parameter 1 is not a variable model parameter and no confidence range will be calculated.
Parameter Confidence Range (2.706)
*** Parameter 2 is not a variable model parameter and no confidence range will be calculated.
Parameter Confidence Range (2.706)
Parameter Confidence Range (2.706)
18 channels (63-80) ignored in spectrum # 1
Fit statistic : Chi-Squared 1249.01 using 58 bins.
Test statistic : Chi-Squared 1249.01 using 58 bins.
Null hypothesis probability of 1.75e-224 with 56 degrees of freedom
Current data and model not fit yet.
Warning: renorm - no variable model to allow renormalization
*** Parameter 1 is not a variable model parameter and no confidence range will be calculated.
Parameter Confidence Range (2.706)
Fit statistic : Chi-Squared 1249.01 using 58 bins.
Test statistic : Chi-Squared 1249.01 using 58 bins.
Null hypothesis probability of 1.75e-224 with 56 degrees of freedom
Current data and model not fit yet.
*** Parameter 2 is not a variable model parameter and no confidence range will be calculated.
Parameter Confidence Range (2.706)
Warning: renorm - no variable model to allow renormalization
Parameter Confidence Range (2.706)
4 channels (1-4) ignored in spectrum # 1
*** Parameter 1 is not a variable model parameter and no confidence range will be calculated.
Parameter Confidence Range (2.706)
*** Parameter 2 is not a variable model parameter and no confidence range will be calculated.
Parameter Confidence Range (2.706)
Parameters
Chi-Squared |beta|/N Lvl 3:lg10Flux 4:PhoIndex
Parameter Confidence Range (2.706)
3 -7.50341 -7.32089 (-0.100311,0.0822072)
Parameter Confidence Range (2.706)
1125.45 1.49456 1 -7.38993 0.263659
18 channels (63-80) ignored in spectrum # 1
713.805 70.6412 0 -6.90176 1.97601
Fit statistic : Chi-Squared 1237.10 using 58 bins.
Test statistic : Chi-Squared 1237.10 using 58 bins.
Null hypothesis probability of 5.20e-222 with 56 degrees of freedom
Current data and model not fit yet.
Warning: renorm - no variable model to allow renormalization
Fit statistic : Chi-Squared 1237.10 using 58 bins.
Test statistic : Chi-Squared 1237.10 using 58 bins.
Null hypothesis probability of 5.20e-222 with 56 degrees of freedom
Current data and model not fit yet.
Warning: renorm - no variable model to allow renormalization
153.753 257.01 0 -6.38008 1.83086
Parameters
Chi-Squared |beta|/N Lvl 3:lg10Flux 4:PhoIndex
80.1997 103.323 -1 -6.28751 1.38618
3 -6.52567 -6.44016 (-0.044645,0.040869)
Parameter Confidence Range (2.706)
78.2729 47.2286 -2 -6.26736 1.35174
78.2729 0.066333 -3 -6.26732 1.35136
1205.66 1.90792 1 -8.15977 0.763946
==============================
Variances and Principal Axes
3 4
1.5738E-04| 0.9925 0.1220
3.0503E-03| -0.1220 0.9925
------------------------------
========================
Covariance Matrix
1 2
2.005e-04 -3.504e-04
-3.504e-04 3.007e-03
------------------------
========================================================================
Model cflux<1>*powerlaw<2> Source No.: 1 Active/On
Model Model Component Parameter Unit Value
par comp
1 1 cflux Emin keV 15.0000 frozen
2 1 cflux Emax keV 150.000 frozen
3 1 cflux lg10Flux cgs -6.26732 +/- 1.41587E-02
4 2 powerlaw PhoIndex 1.35136 +/- 5.48376E-02
5 2 powerlaw norm 1.00000E-03 frozen
________________________________________________________________________
Fit statistic : Chi-Squared 78.27 using 58 bins.
Test statistic : Chi-Squared 78.27 using 58 bins.
Null hypothesis probability of 2.63e-02 with 56 degrees of freedom
1169.06 20.1112 1 -7.93632 1.46283
619.807 40.9448 0 -6.72442 3.72414
306.824 172.664 0 -6.71937 2.56582
90.0406 223.447 -1 -6.45568 1.37851
51.8166 108.428 -2 -6.44936 1.71605
51.5063 5.05809 -3 -6.44586 1.68447
51.506 0.223408 -4 -6.44592 1.68548
==============================
Variances and Principal Axes
3 4
1.5558E-04| 0.9935 0.1138
3.1304E-03| -0.1138 0.9935
------------------------------
========================
Covariance Matrix
1 2
1.941e-04 -3.362e-04
-3.362e-04 3.092e-03
------------------------
========================================================================
Model cflux<1>*powerlaw<2> Source No.: 1 Active/On
Model Model Component Parameter Unit Value
par comp
1 1 cflux Emin keV 15.0000 frozen
2 1 cflux Emax keV 150.000 frozen
3 1 cflux lg10Flux cgs -6.44592 +/- 1.39312E-02
4 2 powerlaw PhoIndex 1.68548 +/- 5.56046E-02
5 2 powerlaw norm 1.00000E-03 frozen
________________________________________________________________________
Fit statistic : Chi-Squared 51.51 using 58 bins.
Test statistic : Chi-Squared 51.51 using 58 bins.
Null hypothesis probability of 6.45e-01 with 56 degrees of freedom
3 -6.76042 -6.65986 (-0.0529072,0.047645)
Parameter Confidence Range (2.706)
4 0.964436 1.6596 (-0.349987,0.345178)
*** Parameter 5 is not a variable model parameter and no confidence range will be calculated.
Parameter Confidence Range (2.706)
*** Parameter 1 is not a variable model parameter and no confidence range will be calculated.
Parameter Confidence Range (2.706)
*** Parameter 2 is not a variable model parameter and no confidence range will be calculated.
Parameter Confidence Range (2.706)
Parameter Confidence Range (2.706)
3 -6.8729 -6.75159 (-0.064167,0.0571425)
Parameter Confidence Range (2.706)
4 1.35694 1.67674 (-0.158695,0.1611)
*** Parameter 5 is not a variable model parameter and no confidence range will be calculated.
Parameter Confidence Range (2.706)
3 -7.06965 -6.95934 (-0.0582166,0.0520879)
Parameter Confidence Range (2.706)
4 1.34779 1.69663 (-0.172258,0.176583)
*** Parameter 5 is not a variable model parameter and no confidence range will be calculated.
Parameter Confidence Range (2.706)
*** Parameter 1 is not a variable model parameter and no confidence range will be calculated.
Parameter Confidence Range (2.706)
*** Parameter 2 is not a variable model parameter and no confidence range will be calculated.
Parameter Confidence Range (2.706)
Parameter Confidence Range (2.706)
4 1.55123 1.9464 (-0.19338,0.201787)
*** Parameter 5 is not a variable model parameter and no confidence range will be calculated.
Parameter Confidence Range (2.706)
3 -6.29133 -6.24445 (-0.0240153,0.0228634)
Parameter Confidence Range (2.706)
4 1.91314 2.39342 (-0.230145,0.250139)
*** Parameter 5 is not a variable model parameter and no confidence range will be calculated.
Parameter Confidence Range (2.706)
3 -6.46942 -6.42352 (-0.0234961,0.0223994)
Parameter Confidence Range (2.706)
4 1.26009 1.44294 (-0.091263,0.091589)
*** Parameter 5 is not a variable model parameter and no confidence range will be calculated.
Parameter Confidence Range (2.706)
4 1.59586 1.77629 (-0.0895824,0.0908406)
*** Parameter 5 is not a variable model parameter and no confidence range will be calculated.
Parameter Confidence Range (2.706)
The condition here is 1.9610616748352666e-07 [1.7361371566294146e-07, 2.1884479005588168e-07] 3 2.261553719647011e-08 1.2825955589411632e-07
The condition here is 1.5533312217640978e-07 [1.3399760627772665e-07, 1.771767004546202e-07] 3 2.1589547088446778e-08 9.056448091106944e-08
The condition here is 5.40358804881536e-07 [5.112896193493109e-07, 5.695680648939427e-07] 3 2.9139222772315898e-08 4.529411365645883e-07
The condition here is 3.581632829962011e-07 [3.393008516076485e-07, 3.771207766202966e-07] 3 1.8909962506324052e-08 3.0143339547722895e-07
The condition here is 3.952798678649419e-08 [3.1375723504260376e-08, 4.776523695325426e-08] 3 8.194756724496942e-09 1.4943716613003362e-08
The condition here is 3.303510922260287e-07 [2.980785915147992e-07, 3.629482706084854e-07] 3 3.2434839546843105e-08 2.330465735854994e-07
The condition here is 9.740203320562503e-08 [8.518271290340573e-08, 1.098135481529852e-07] 3 1.2315417624789732e-08 6.045578033125584e-08
1 spectrum in use
Spectral Data File: t_647252293.016-647252296.792_80chan.pha Spectrum 1
Net count rate (cts/s) for Spectrum:1 6.451e-02 +/- 7.816e-03
Assigned to Data Group 1 and Plot Group 1
Noticed Channels: 1-80
Telescope: SWIFT Instrument: BAT Channel Type: PI
Exposure Time: 3.776 sec
Using fit statistic: chi
Using Response (RMF) File t_647252293.016-647252296.792_80chan.rsp for Source 1
========================================================================
Model cflux<1>*powerlaw<2> Source No.: 1 Active/On
Model Model Component Parameter Unit Value
par comp
1 1 cflux Emin keV 15.0000 frozen
2 1 cflux Emax keV 150.000 frozen
3 1 cflux lg10Flux cgs -9.00000 +/- 0.0
4 2 powerlaw PhoIndex -1.00000 +/- 0.0
5 2 powerlaw norm 1.00000E-03 frozen
________________________________________________________________________
Fit statistic : Chi-Squared 154.82 using 80 bins.
***Warning: Chi-square may not be valid due to bins with zero variance
in spectrum number: 1
Test statistic : Chi-Squared 154.82 using 80 bins.
***Warning: Chi-square may not be valid due to bins with zero variance
in spectrum number(s): 1
Null hypothesis probability of 5.25e-07 with 78 degrees of freedom
Current data and model not fit yet.
Default fit statistic is set to: Chi-Squared
This will apply to all current and newly loaded spectra.
Fit statistic : Chi-Squared 154.82 using 80 bins.
***Warning: Chi-square may not be valid due to bins with zero variance
in spectrum number: 1
Test statistic : Chi-Squared 154.82 using 80 bins.
***Warning: Chi-square may not be valid due to bins with zero variance
in spectrum number(s): 1
Null hypothesis probability of 5.25e-07 with 78 degrees of freedom
Current data and model not fit yet.
4 channels (1-4) ignored in spectrum # 1
18 channels (63-80) ignored in spectrum # 1
Fit statistic : Chi-Squared 131.05 using 58 bins.
Test statistic : Chi-Squared 131.05 using 58 bins.
Null hypothesis probability of 5.92e-08 with 56 degrees of freedom
Current data and model not fit yet.
Warning: renorm - no variable model to allow renormalization
Fit statistic : Chi-Squared 131.05 using 58 bins.
Test statistic : Chi-Squared 131.05 using 58 bins.
Null hypothesis probability of 5.92e-08 with 56 degrees of freedom
Current data and model not fit yet.
Warning: renorm - no variable model to allow renormalization
Parameters
Chi-Squared |beta|/N Lvl 3:lg10Flux 4:PhoIndex
108.754 0.798333 0 -8.40716 2.90676
97.6954 12.3834 0 -8.23847 3.24910
65.4894 16.4614 0 -7.75387 3.16230
57.8636 6.3119 -1 -7.62136 2.25687
56.6648 9.48654 -2 -7.55152 2.19068
56.662 0.54438 -3 -7.55391 2.18924
==============================
Variances and Principal Axes
3 4
2.3752E-03| 0.9875 0.1576
6.4622E-02| -0.1576 0.9875
------------------------------
========================
Covariance Matrix
1 2
3.922e-03 -9.690e-03
-9.690e-03 6.307e-02
------------------------
========================================================================
Model cflux<1>*powerlaw<2> Source No.: 1 Active/On
Model Model Component Parameter Unit Value
par comp
1 1 cflux Emin keV 15.0000 frozen
2 1 cflux Emax keV 150.000 frozen
3 1 cflux lg10Flux cgs -7.55391 +/- 6.26267E-02
4 2 powerlaw PhoIndex 2.18924 +/- 0.251147
5 2 powerlaw norm 1.00000E-03 frozen
________________________________________________________________________
Fit statistic : Chi-Squared 56.66 using 58 bins.
Test statistic : Chi-Squared 56.66 using 58 bins.
Null hypothesis probability of 4.50e-01 with 56 degrees of freedom
*** Parameter 1 is not a variable model parameter and no confidence range will be calculated.
Parameter Confidence Range (2.706)
*** Parameter 2 is not a variable model parameter and no confidence range will be calculated.
Parameter Confidence Range (2.706)
Parameter Confidence Range (2.706)
3 -7.67161 -7.4567 (-0.117701,0.0972087)
Parameter Confidence Range (2.706)
4 1.77721 2.67801 (-0.411869,0.488937)
*** Parameter 5 is not a variable model parameter and no confidence range will be calculated.
Parameter Confidence Range (2.706)
The condition here is 2.793124246555646e-08 [2.1300459703409617e-08, 3.4938070758627735e-08] 3 6.818805527609059e-09 7.474825882729281e-09
We extract the spectrum in the whole \(t_{90}\) interval
spectrum_t90=event.create_pha(tstart=lc.tdurs['T90']['TSTART'], tstop=lc.tdurs['T90']['TSTOP'], recalc=True)
Then we build an averare Detector Response Matrix, to take into account that during \(t_{90}\) interval the position of the source changes across the FOV. The average is weighted by the totals counts accumulated during each bayesian block
! rm -f {spectrum_t90.pha_file.parent.joinpath("avg_drm.rsp")}
avg_drm=ba.BatDRM.concatenate([i.drm for i in output_bayesian_spectra],
                            weights=lc.data["TOTCOUNTS"][mask]/np.sum(lc.data["TOTCOUNTS"][mask]),
                            drm_save_file=spectrum_t90.pha_file.parent.joinpath("avg_drm.rsp"))

spectrum_t90.drm_file=spectrum_t90.pha_file.parent.joinpath("avg_drm.rsp")
ba.fit_spectrum(spectrum_t90, generic_model="cflux*po",
                setPars={1:"15,-1", 2:"150,-1",3:-9, 4:"-1",5:".001,-1"},
                use_cstat=False, fit_iterations=10000)
Warning: RMF CHANTYPE keyword (UNKNOWN) is not consistent with that in spectrum (PI)

1 spectrum  in use

Spectral Data File: t_647252296.024-647252304.2159998_80chan.pha  Spectrum 1
Net count rate (cts/s) for Spectrum:1  3.673e-01 +/- 8.905e-03
 Assigned to Data Group 1 and Plot Group 1
  Noticed Channels:  1-80
  Telescope: SWIFT Instrument: BAT  Channel Type: PI
  Exposure Time: 8.192 sec
 Using fit statistic: chi
 Using Response (RMF) File            avg_drm.rsp for Source 1


Fit statistic  : Chi-Squared                   64.02     using 80 bins.

***Warning: Chi-square may not be valid due to bins with zero variance
            in spectrum number: 1

Test statistic : Chi-Squared                   64.02     using 80 bins.

***Warning: Chi-square may not be valid due to bins with zero variance
            in spectrum number(s): 1

 Null hypothesis probability of 8.73e-01 with 78 degrees of freedom
 Current data and model not fit yet.

========================================================================
Model cflux<1>*powerlaw<2> Source No.: 1   Active/On
Model Model Component  Parameter  Unit     Value
 par  comp
   1    1   cflux      Emin       keV      15.0000      frozen
   2    1   cflux      Emax       keV      150.000      frozen
   3    1   cflux      lg10Flux   cgs      -9.00000     +/-  0.0
   4    2   powerlaw   PhoIndex            -1.00000     +/-  0.0
   5    2   powerlaw   norm                1.00000E-03  frozen
________________________________________________________________________


Fit statistic  : Chi-Squared                 2704.34     using 80 bins.

***Warning: Chi-square may not be valid due to bins with zero variance
            in spectrum number: 1

Test statistic : Chi-Squared                 2704.34     using 80 bins.

***Warning: Chi-square may not be valid due to bins with zero variance
            in spectrum number(s): 1

 Null hypothesis probability of 0.00e+00 with 78 degrees of freedom
 Current data and model not fit yet.
Default fit statistic is set to: Chi-Squared
   This will apply to all current and newly loaded spectra.

Fit statistic  : Chi-Squared                 2704.34     using 80 bins.

***Warning: Chi-square may not be valid due to bins with zero variance
            in spectrum number: 1

Test statistic : Chi-Squared                 2704.34     using 80 bins.

***Warning: Chi-square may not be valid due to bins with zero variance
            in spectrum number(s): 1

 Null hypothesis probability of 0.00e+00 with 78 degrees of freedom
 Current data and model not fit yet.
     4 channels (1-4) ignored in spectrum #     1
    18 channels (63-80) ignored in spectrum #     1

Fit statistic  : Chi-Squared                 2650.95     using 58 bins.

Test statistic : Chi-Squared                 2650.95     using 58 bins.
 Null hypothesis probability of 0.00e+00 with 56 degrees of freedom
 Current data and model not fit yet.

 Warning: renorm - no variable model to allow  renormalization

Fit statistic  : Chi-Squared                 2650.95     using 58 bins.

Test statistic : Chi-Squared                 2650.95     using 58 bins.
 Null hypothesis probability of 0.00e+00 with 56 degrees of freedom
 Current data and model not fit yet.
 Warning: renorm - no variable model to allow  renormalization
                                   Parameters
Chi-Squared  |beta|/N    Lvl    3:lg10Flux    4:PhoIndex
2610.71      7.83326       1      -8.45384     -0.187907
2554.55      30.9964       1      -8.24682      0.767018
2484.88      63.2913       1      -8.08369       1.23114
1161.91      102.674       0      -7.05441       3.26937
566.926      370.367       0      -6.93906       2.06680
87.1524      685.981      -1      -6.62206       1.42021
50.237       228.916      -2      -6.66332       1.59493
50.0971      5.65794      -3      -6.66505       1.60913
50.0971      0.0294826    -4      -6.66505       1.60907
==============================
 Variances and Principal Axes
                 3        4
 7.0988E-05|  0.9957   0.0931
 1.4879E-03| -0.0931   0.9957
------------------------------

========================
  Covariance Matrix
        1           2
   8.326e-05  -1.313e-04
  -1.313e-04   1.476e-03
------------------------

========================================================================
Model cflux<1>*powerlaw<2> Source No.: 1   Active/On
Model Model Component  Parameter  Unit     Value
 par  comp
   1    1   cflux      Emin       keV      15.0000      frozen
   2    1   cflux      Emax       keV      150.000      frozen
   3    1   cflux      lg10Flux   cgs      -6.66505     +/-  9.12451E-03
   4    2   powerlaw   PhoIndex            1.60907      +/-  3.84141E-02
   5    2   powerlaw   norm                1.00000E-03  frozen
________________________________________________________________________


Fit statistic  : Chi-Squared                   50.10     using 58 bins.

Test statistic : Chi-Squared                   50.10     using 58 bins.
 Null hypothesis probability of 6.97e-01 with 56 degrees of freedom

Parameters defined:
========================================================================
Model cflux<1>*powerlaw<2> Source No.: 1   Active/On
Model Model Component  Parameter  Unit     Value
 par  comp
   1    1   cflux      Emin       keV      15.0000      frozen
   2    1   cflux      Emax       keV      150.000      frozen
   3    1   cflux      lg10Flux   cgs      -6.66505     +/-  9.12451E-03
   4    2   powerlaw   PhoIndex            1.60907      +/-  3.84141E-02
   5    2   powerlaw   norm                1.00000E-03  frozen
________________________________________________________________________


Fit statistic  : Chi-Squared                   50.10     using 58 bins.

Test statistic : Chi-Squared                   50.10     using 58 bins.
 Null hypothesis probability of 6.97e-01 with 56 degrees of freedom
*** Parameter 1 is not a variable model parameter and no confidence range will be calculated.
 Parameter   Confidence Range (2.706)
*** Parameter 2 is not a variable model parameter and no confidence range will be calculated.
 Parameter   Confidence Range (2.706)
 Parameter   Confidence Range (2.706)
     3     -6.68036     -6.65023    (-0.015305,0.0148243)
 Parameter   Confidence Range (2.706)
     4      1.54624      1.67225    (-0.0628337,0.0631747)
*** Parameter 5 is not a variable model parameter and no confidence range will be calculated.
 Parameter   Confidence Range (2.706)
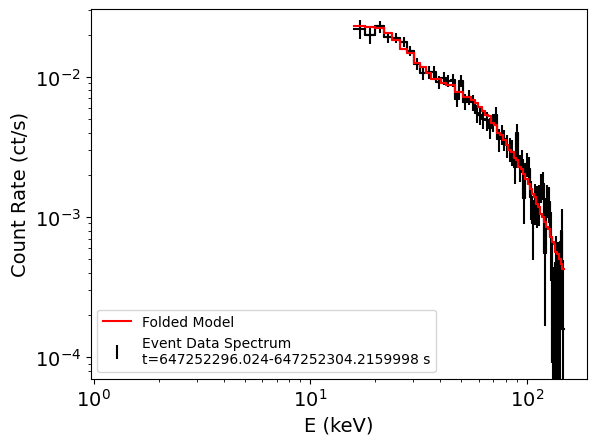
params = spectrum_t90.spectral_model['parameters']
lg10_flux = params['lg10Flux']
flux = 10 ** lg10_flux['val']
flux_lo = 10 ** lg10_flux['lolim']
flux_hi = 10 ** lg10_flux['hilim']

print(f"Converted flux: best fit = {flux:.3e}, interval = ({flux_lo:.3e}, {flux_hi:.3e})")
# photon index
photon_index = params['PhoIndex']['val']
photon_index_lo = params['PhoIndex']['lolim']
photon_index_hi = params['PhoIndex']['hilim']

print(f"Photon index: best fit = {photon_index:.3f}, interval = ({photon_index_lo:.3f}, {photon_index_hi:.3f})")
Converted flux: best fit = 2.162e-07, interval = (2.088e-07, 2.238e-07)
Photon index: best fit = 1.609, interval = (1.546, 1.672)
Time resolved spectra using Bayesian blocks#
from batanalysis.batlib import concatenate_spectrum_data

spect_data = concatenate_spectrum_data(output_bayesian_spectra, ["flux", "phoindex"])
fig, axes = plt.subplots(3, sharex=True, figsize=(6, 12))

start_times = lc.tbins["TIME_START"]-t0*u.s
end_times = lc.tbins["TIME_STOP"]-t0*u.s
mid_times = lc.tbins["TIME_CENT"]-t0*u.s

bin_start_rel = (spect_data["TIME_START"] - t0 * u.s).to_value(u.s)
bin_stop_rel = (spect_data["TIME_STOP"] - t0 * u.s).to_value(u.s)
bin_colors = ["#ffe9e9", "#b7cefc"]
for idx, (start, stop) in enumerate(zip(bin_start_rel, bin_stop_rel)):
    color = bin_colors[idx % len(bin_colors)]
    for ax in axes:
        ax.axvspan(start, stop, color=color, alpha=0.25, zorder=0)

edges_rel = np.unique(np.concatenate([bin_start_rel, [bin_stop_rel[-1]]]))
for edge in edges_rel:
    for ax in axes:
        ax.axvline(edge, color="0.75", linewidth=0.8, alpha=0.7, zorder=1)

rate = lc.data['RATE']
rate_error = lc.data["ERROR"]

line = axes[0].plot(start_times, rate, ds='steps-post')
line_handle, = axes[0].plot(end_times, rate, ds='steps-pre', color=line[-1].get_color())

flux = spect_data['flux']
flux_lolim = spect_data['flux_lolim']
flux_hilim = spect_data['flux_hilim']

axes[0].errorbar(mid_times, rate, yerr=rate_error, ls='None', color=line[-1].get_color())
axes[0].set_ylabel('Count rate (ct/s)')

axes[0].axvline(lc.tdurs['T90']['TSTART'].value-t0, color='green', alpha=0.5, label="t90 start")
axes[0].axvline(lc.tdurs['T90']['TSTOP'].value-t0, color='red', alpha=0.5, label="t90 stop")

axes[0].legend()

spec_param = 'flux'

y = spect_data[spec_param]

# get the errors
lolim = spect_data[f"{spec_param}_lolim"]
hilim = spect_data[f"{spec_param}_hilim"]

yerr = np.array([lolim, hilim])
y_upperlim = spect_data[f"{spec_param}_upperlim"]

# find where we have upper limits and set the error to 1 since the nan error value isnt
# compatible with upperlimits
yerr[:, y_upperlim] = 0.2 * y[y_upperlim]

tbin_cent = 0.5 * (spect_data["TIME_START"] + spect_data["TIME_STOP"])
tbin_err = 0.5 * (spect_data["TIME_STOP"] - spect_data["TIME_START"])

axes[1].errorbar(
    tbin_cent-t0*u.s,
    y,
    xerr=tbin_err,
    yerr=yerr,
    uplims=y_upperlim,
    linestyle="None",
    marker="o",
    markersize=3,
    zorder=3,
)  # color="red"

axes[1].set_ylabel('Flux ($erg \, cm^{-2} s^{-1}$)')

spec_param = 'phoindex'

y = spect_data[spec_param]

# get the errors
lolim = spect_data[f"{spec_param}_lolim"]
hilim = spect_data[f"{spec_param}_hilim"]

yerr = np.array([lolim, hilim])
y_upperlim = spect_data[f"{spec_param}_upperlim"]

axes[2].errorbar(
    tbin_cent-t0*u.s,
    y,
    xerr=tbin_err,
    yerr=yerr,
    uplims=y_upperlim,
    linestyle="None",
    marker="o",
    markersize=3,
    zorder=3,
)  # color="red"

axes[2].set_ylabel('PhoIndex')
plt.xlim(min(spect_data["TIME_START"].value - t0) - 1, max(spect_data["TIME_STOP"].value - t0) + 1)
plt.xlabel('Time (s) - t0')
plt.tight_layout()